Blog post
Insights
Email List Segmentation: Approaches and Data That Work
A store with 10,000 subscribers sends one email. A shopper who bought a gift card last week and is waiting for the new season drop gets it. So does a customer who bought twice last year and hasn't opened anything since spring, and so does someone who signed up for the welcome discount, never bought, and is still deciding. The same 20% off message lands in all three inboxes, and for at least two of them it's noise.
The numbers suggest that noise is expensive. When Constant Contact studied 37,000 customers in 2025, it found that 80% of its most successful customers had sent a resend-to-non-openers newsletter, a second, smaller message aimed only at people who skipped the first (Constant Contact's list segmentation practices). The high performers weren't mailing more often. They were mailing a defined group with a different message.
Email list segmentation is the practice of dividing one subscriber list into groups that share a trait, then writing to each group separately. Most brands have heard the term. Fewer can show what a segment earned them, and fewer still know when a broad send is the better call. The sections below work through the segment types worth building, the rules that keep them honest, the metrics that survive modern inbox privacy, and the cases where splitting your list loses money.
A 10,000-person list can contain subscribers with very different needs. A recent gift-card buyer may be ready to pay full price, while a lapsed repeat buyer could respond to a reason to return. Someone still deciding may need useful information before an offer. Sending all three the same discount risks wasting it on the first person and missing what matters to the others.
A librarian faces a similar challenge. Rather than hand every visitor the same book, she remembers who likes crime novels, who returned a book late, and who asked about gardening. That memory helps her make a more relevant recommendation. Email list segmentation applies the same idea to subscribers: group them by signals such as purchase history, product interest, engagement, or relationship stage, then tailor the message.
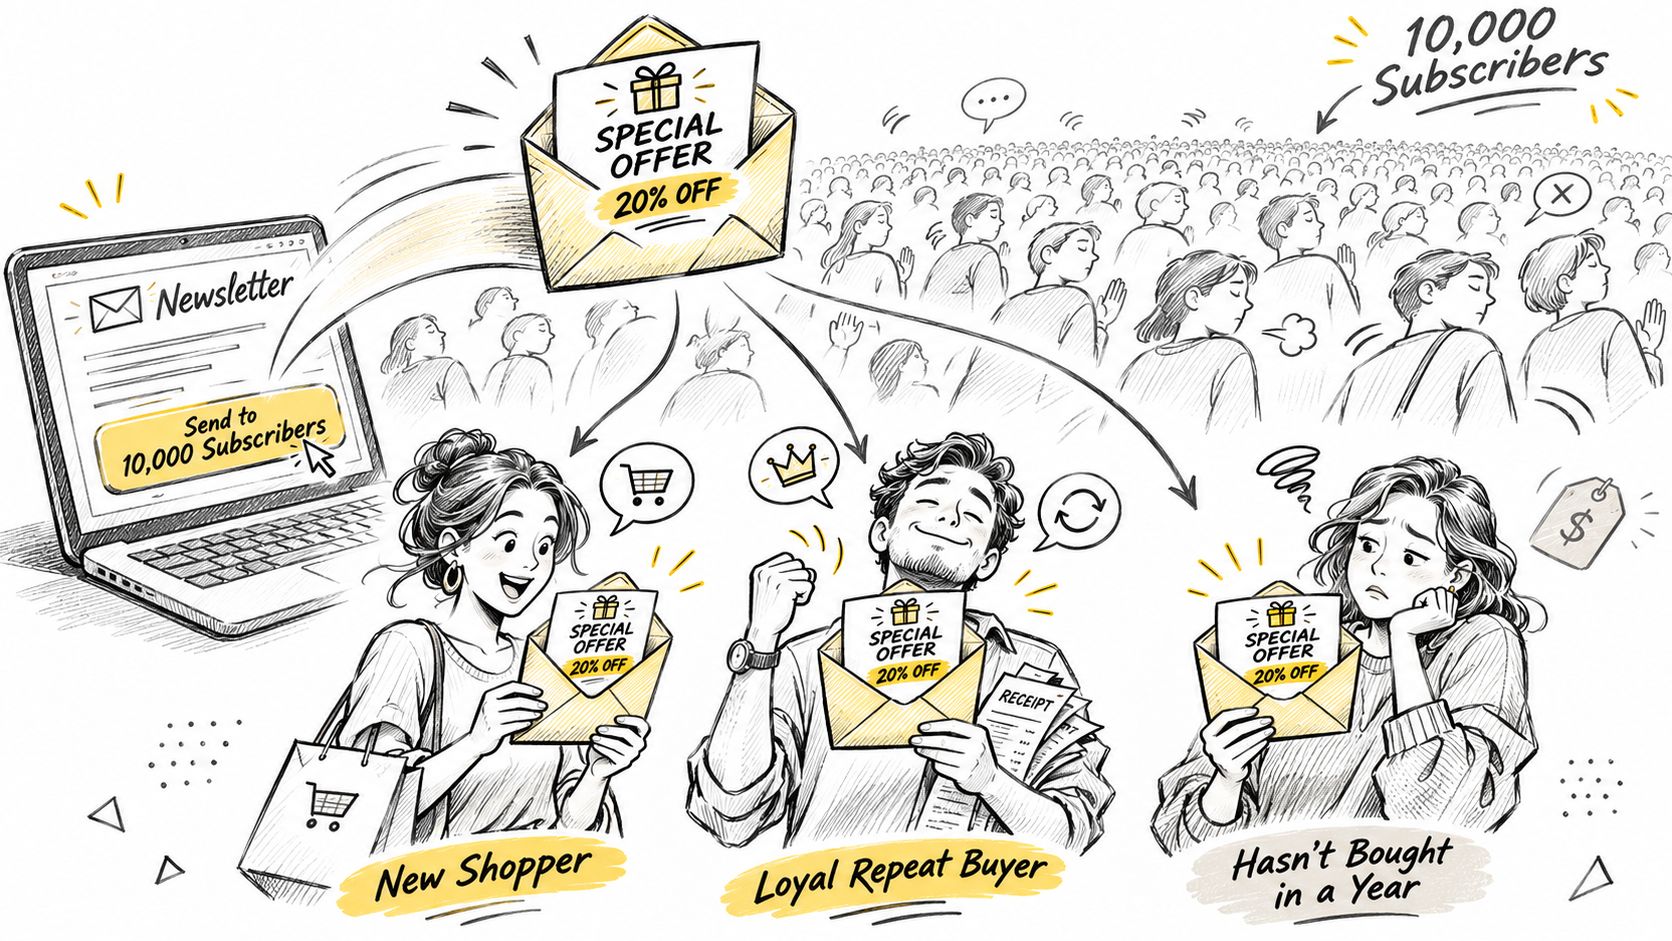
The illustration shows how one list can be divided into groups, each receiving an offer suited to its members.
Mailchimp's benchmark resource provides context for assessing email performance, but it does not report the specific 2017 study figures sometimes attributed to it (Mailchimp's email marketing benchmarks). So avoid treating those precise comparisons as established by this page. The general lesson is still practical: relevance gives a campaign a better chance of earning attention and clicks than a message that ignores what subscribers have done or need.
Clicks are a useful place to start. They show whether a message prompted a reader to act, rather than merely appearing in an inbox. But segmentation should not be judged by clicks alone. Compare revenue per recipient and, where possible, incremental lift: whether the targeted send generated more value than a suitable broad-send comparison. Open rates can offer context, but Apple Mail Privacy Protection makes them unreliable as a stand-alone measure.
Relevance is the goal. Segmentation is one way to deliver it.
A segment is not automatically better just because it is narrower. If a group is too small, or its members do not need different messages, dividing the list can add work without improving results. A broad send may be the clearer choice when the offer applies equally to the audience. Judge the decision by recipient response and business outcomes, not by how many groups the list can be split into.
When segmentation does help, watch for changes in clicks, revenue per recipient, and unsubscribes. Those measures connect the message to reader action and business value. Fewer bounces and complaints can also indicate healthier sending, but they do not prove that segmentation alone caused the change. Treat performance as evidence to guide the next campaign, not as a guarantee.
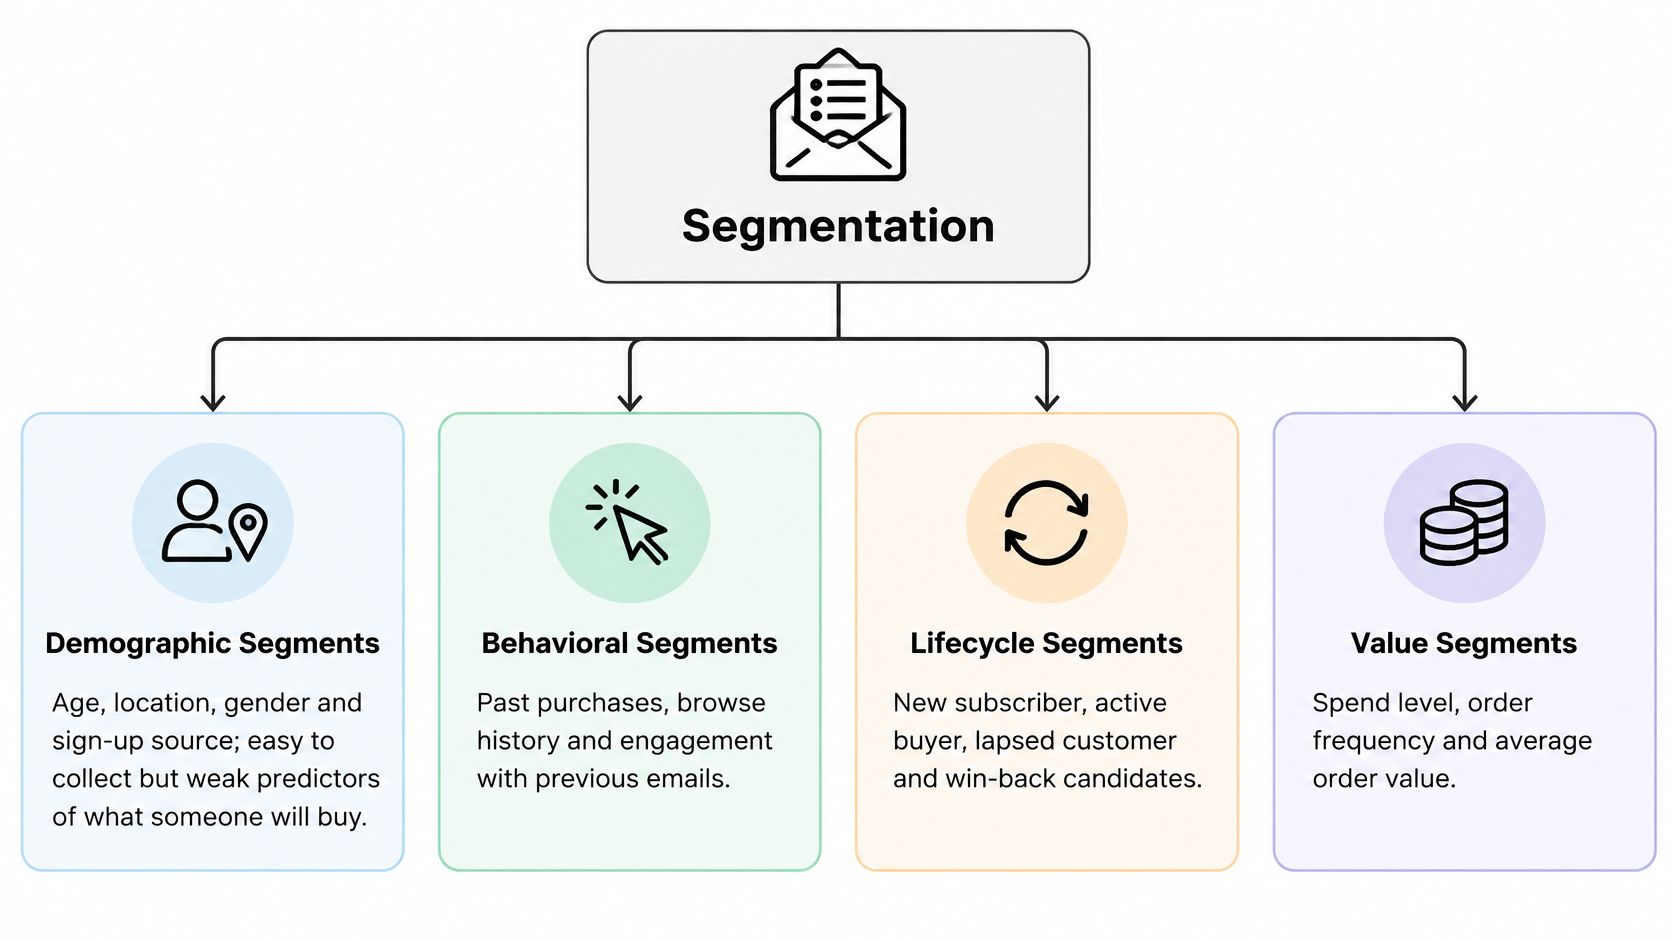
Six types cover almost everything an ecommerce brand needs in its first year, and they aren't equally useful. The table lines up the data each one uses, a rule you can copy, and what it's best at, before the walkthrough explains why some types predict a purchase and others barely nudge it.
| Segment type | Data points | Example rule | Best used for |
|---|---|---|---|
| Demographic | Age, location, gender, sign-up source | Subscribers aged 25-34 in one region | Early personalization and sign-up forms |
| Behavioral | Clicks, site visits, product page views | Clicked a product email in the last 30 days | Timing and relevance of promotions |
| Purchase history | First purchase date, order count, last order date, category bought | Bought once, 90+ days ago | Replenishment and cross-sell emails |
| Value | Average order value, customer lifetime value | AOV above $100 | Premium offers and VIP access |
| Preference | Topics or product lines chosen by the subscriber | Chose skincare, not apparel | Content matched to stated interest |
| Lifecycle stage | Subscribe date, first order, repeat order, last purchase | No order in 180 days | Welcome, win-back and retention flows |
Demographic segments are the easiest to collect and the weakest at predicting what someone will buy. A subscriber in the right postcode isn't necessarily shopping for the product in your hero image. Use them to branch a welcome series or localize an event invite, not to decide the offer.
Behavioral segments track clicks, site visits and product page views, and they come closest to live intent. "Clicked a product email in the last 30 days" is a real signal that someone is still shopping. Lean on clicks rather than opens here, for reasons that come up shortly.
Purchase-history segments use first order date, order count, last order date and the category bought. They drive replenishment and cross-sell, and a simple rule like "bought once, 90+ days ago" builds a decent second-purchase audience on its own. If you sell print-on-demand, the segmentation examples for print-on-demand shoppers show how product category and buyer intent turn into rules you can build.
Value segments rank buyers by worth using average order value and predicted lifetime value, so premium offers and early access reach the people most likely to spend. Preference segments rely on what the subscriber told you, through a quiz or preference centre, which makes content matching straightforward.
Lifecycle segments group people as new subscribers, first-time buyers, repeat buyers, lapsed customers or dormant contacts. This is the backbone most retention flows hang from, and it's worth mapping the customer lifecycle phases before you name a single segment.
For a walkthrough of how these groups look once they're live inside a platform, the video below covers the setup.
The strongest programs combine one lifecycle segment with one behavioral or value signal. Age and location alone rarely change what someone buys. A lifecycle stage plus a recent click does.
A segment is a decision, and decisions need three parts: something that puts a contact in, something that takes them out, and something that stops a conflicting message from arriving. Those entry, exit and suppression conditions sit at the centre of rule design in this guide to list segmentation, and skipping any of the three is where most builds go wrong.
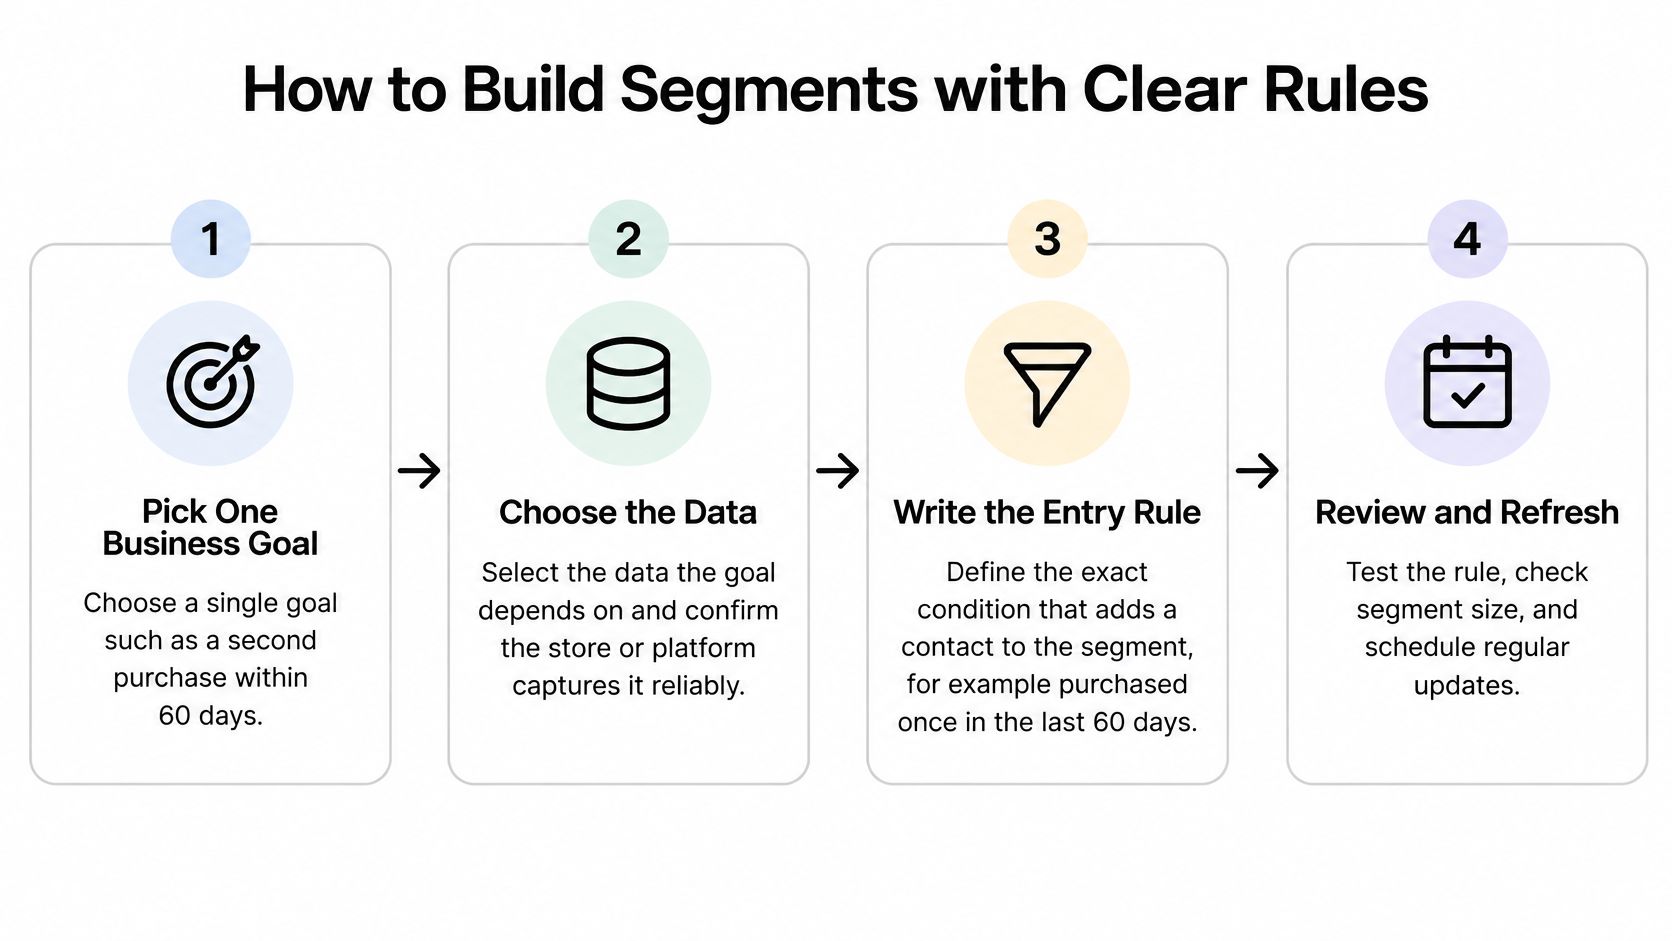
The eight steps below follow that logic from goal to launch. Each one comes with the mistake it prevents.
Rule of thumb: a segment should change what the reader receives, or it doesn't need to exist.
A high first order does not always signal a high-value customer. Value-based segments add context to purchase behavior, helping you tailor offers to what customers have spent and what they may spend next.
Average order value (AOV) is a useful starting point because it describes past purchases rather than predicting future ones. Klaviyo calculates AOV by dividing the total monetary value of conversions by the number of conversions, then lets you compare each customer's AOV with a threshold (Klaviyo's guide to AOV segments). For example, a brand might define high AOV as above $100 and medium AOV as $50 to $100. These are illustrative thresholds, not Klaviyo standards. Keeping the bands distinct means a customer belongs to one group rather than qualifying for both.
The point of setting bands is to connect them to different messages. High-AOV customers may receive premium cross-sell messaging or early access, while medium-AOV shoppers may respond better to lower-risk replenishment offers. These choices should reflect your products and customer behavior, not an assumption that every high spender wants the same thing.
A mismatched offer can work against the goal. A steep discount for your highest-spending group may teach customers to wait for a deal. A full-price launch email may be a poor fit for cautious first-time buyers. Segmenting by AOV gives you a way to test whether different messages suit each group.
Customer lifetime value (CLV) adds a forward-looking view. Klaviyo defines CLV as the total a customer has already purchased plus the amount they are predicted to purchase over time. Its segment builder supports historic, predicted, or total CLV (Klaviyo's CLV segmentation documentation). Pairing those measures with your own customer lifetime value analysis can help you distinguish an early high-potential customer from someone whose large first basket may not lead to another purchase.
For example, a customer with a small first order but high predicted value may deserve attention before a one-time bargain buyer with a larger basket. Past spend captures what has happened; predicted spend can help prioritize what might happen next. Treat that prediction as a guide for choosing a test, not a guarantee of future purchases.
Predictive features need enough order data to produce usable results. Klaviyo lists prerequisites for features such as predicted CLV and churn risk in its predictive analytics requirements.
| Requirement | Threshold |
|---|---|
| Data source | Ecommerce integration or API sending order data |
| Order history | At least 180 days of order data |
| Recent activity | At least one order in the past 30 days |
| Customer base | At least 500 customers who have placed an order |
| Repeat buyers | Some customers with three or more orders |
If your store does not meet these requirements, AOV and purchase history still provide a practical basis for value segments. Start with the behavior you can observe, and use predictions only when the underlying order data supports them. Otherwise, a precise-looking segment can rest on too little information.
Finally, a predictive segment can include only profiles that are subscribed and able to receive email marketing. Without that eligibility, the audience may appear in the builder but cannot receive the message.
Open rates stopped being a fair test of anything on Apple Mail. Apple's Mail Privacy Protection preloads tracking pixels, which inflates apparent opens, and the deliverability data compiled by ISP in 2025 ISP email deliverability statistics treats open rates as unreliable for Apple Mail users. That matters more than it sounds. If your "engaged" segment is built on opens, it now contains a slice of people who never read the message, and your sunset policy may be removing real buyers.
The fix is to replace opens with signals nobody can preload: clicks, site activity, purchases, product use, replies and controlled re-engagement tests.
| Metric | Why it matters | What to check |
|---|---|---|
| Click rate per delivered message | Shows real interest where opens are inflated by Apple Mail Privacy Protection | Compare clicks by segment against the unsegmented send |
| Revenue per recipient | Ties the segment to money earned | Compare against the unsegmented benchmark in the same analysis |
| Unsubscribes per 1,000 recipients | Shows whether messages feel irrelevant | A rising rate after a new segment signals a mismatch |
| Complaint rate | Protects deliverability | Review every send; a rise means the segment or the offer is wrong |
| Repeat purchase rate | Measures the lifecycle goal directly | Compare against the holdout group |
| Incremental revenue against holdout | Shows causal lift, not correlation | Compare the treated segment with a randomized control group |
Klaviyo's analysis of 2,619,441,297 emails sent by U.S. customers put a number on the gap. Highly segmented campaigns reached a 16.17% average open rate against 9.95% for unsegmented sends, and a 1.99% click-through rate against 0.92% (Klaviyo's segmentation benchmark report). Revenue per recipient, the figure that decides budgets, came in at $0.19 against $0.06, more than three times higher.
That study compares historical campaigns, so the gap is a benchmark rather than proof of cause. Confirm it on your own list with a holdout group or a randomized split test before you quote it to anyone.
Practical rule: don't judge a segment by opens. Judge it by what it delivered and what it cost in list health.
Set a review rhythm and keep it boring. Clicks, unsubscribes and complaints get checked weekly for live flows. Incremental revenue against the holdout gets checked monthly, because it takes that long to mean anything. If you want to connect those numbers to the conversion figures your team already reports, this guide to email marketing conversion rate shows where segment performance and revenue reporting meet.
A segment earns its place when delivered revenue rises and complaint rates hold steady. A higher open count proves nothing.
More segments can lose money. That's the uncomfortable part of this topic, and it deserves a number. A recent pre-holiday analysis found segmented Black Friday and Cyber Monday emails carried roughly 11% higher average order value than unsegmented ones, while noting explicitly that the difference doesn't prove segmentation caused the lift (Validity's benchmark report). Read that as a hypothesis to test, not a settled fact.
The same report covers the cost side. Current sender requirements put weight on SPF, DKIM and DMARC authentication, one-click unsubscribe, and a complaint rate below 0.3% for bulk senders, with Gmail and Yahoo recommending 0.1% or lower. Every extra narrow send adds another chance to cross that line, and complaint rates don't reset politely at month end.
A broad send is the safer choice in four situations. Your segments are too small for the results to be readable. Event data is too sparse for a rule to fire on anything but guesswork. The personalization raises how often each contact hears from you without lifting repeat purchases. Or the creative and data work costs more than the margin the segment could add.
Before you add a segment: ask what it will suppress, not just what it will send.
Use this checklist before the next one goes live.
Judge each segment on incremental margin after discounts. Raw send volume and open counts both flatter a program that isn't earning.
Two segments are enough to start, and they should be the two that need completely different words: first-time buyers and lapsed customers. Both have clear entry points, obvious exit events and measurable outcomes, which makes them the easiest pair to defend when someone asks what the work returned.
First-time buyers enter the segment after one order, exit the moment a second order lands, and are suppressed from acquisition promotions for the whole period. They need product education, a reason to come back and proof that other customers stayed. Lapsed customers enter after a set stretch with no order, exit on purchase, and are suppressed from launches that assume recent engagement. They need a reminder of why they bought in the first place.
We use that same shape on client accounts. For Seat Cover Solutions, we segmented the audience into first-time purchasers, high-LTV customers and dormant leads so each group could receive a different message rather than one catalogue email.
Here's the sequence to run this month.
The scope stays deliberately small: two flows, one message each, and no contact in both at the same time.
If you'd rather not build and test the flows yourself, compare a Klaviyo agency with an in-house build on cost, speed and who owns the test results. The trade is straightforward. An in-house build costs your team's hours and keeps the learning; a partner build costs money upfront and should hand back documented results you can keep running.
The first action is small and it's this week. Export your subscriber list and tag every contact with one lifecycle stage: new, first-time buyer, repeat or lapsed. Everything in this guide starts from that column.
Class A Media builds segmented email and SMS flows for Shopify brands, mapping each flow to a lifecycle stage rather than sending one blast to the whole list. Our email and SMS flows have generated over $150 million in attributable revenue for ecommerce brands, and we work as an official Klaviyo partner on builds that include behavioral segmentation, predictive triggers and holdout testing. If you want your first two segments built, tested and handed over with the results, visit Class A Media.
Let's build retention system that drive predictable, scalable revenue - without ad spend, without retainers, without guesswork.


The Ultimate Ecommerce Email Marketing Agency
Get in touch: hello@classamedia.com