Blog post
Insights
Customer Lifetime Value Analysis: A Margin-Based Guide
You're staring at a dashboard that says email made $61,000 last quarter, and you have no idea whether that's healthy. Open rates look fine. Revenue looks fine. What the dashboard can't tell you is whether the customers you paid to acquire in March were worth acquiring, or whether the ones you'll pay for in June will be.
That gap is what customer lifetime value analysis exists to close. Not another tile on the report, but a budget answer: what this customer is worth in margin, when you get it back, and how much you can spend to win the next one like them.
Most stores build that answer on revenue and then set ad budgets against it. That's how a brand scales a channel that pays back on a spreadsheet and loses money in the bank.
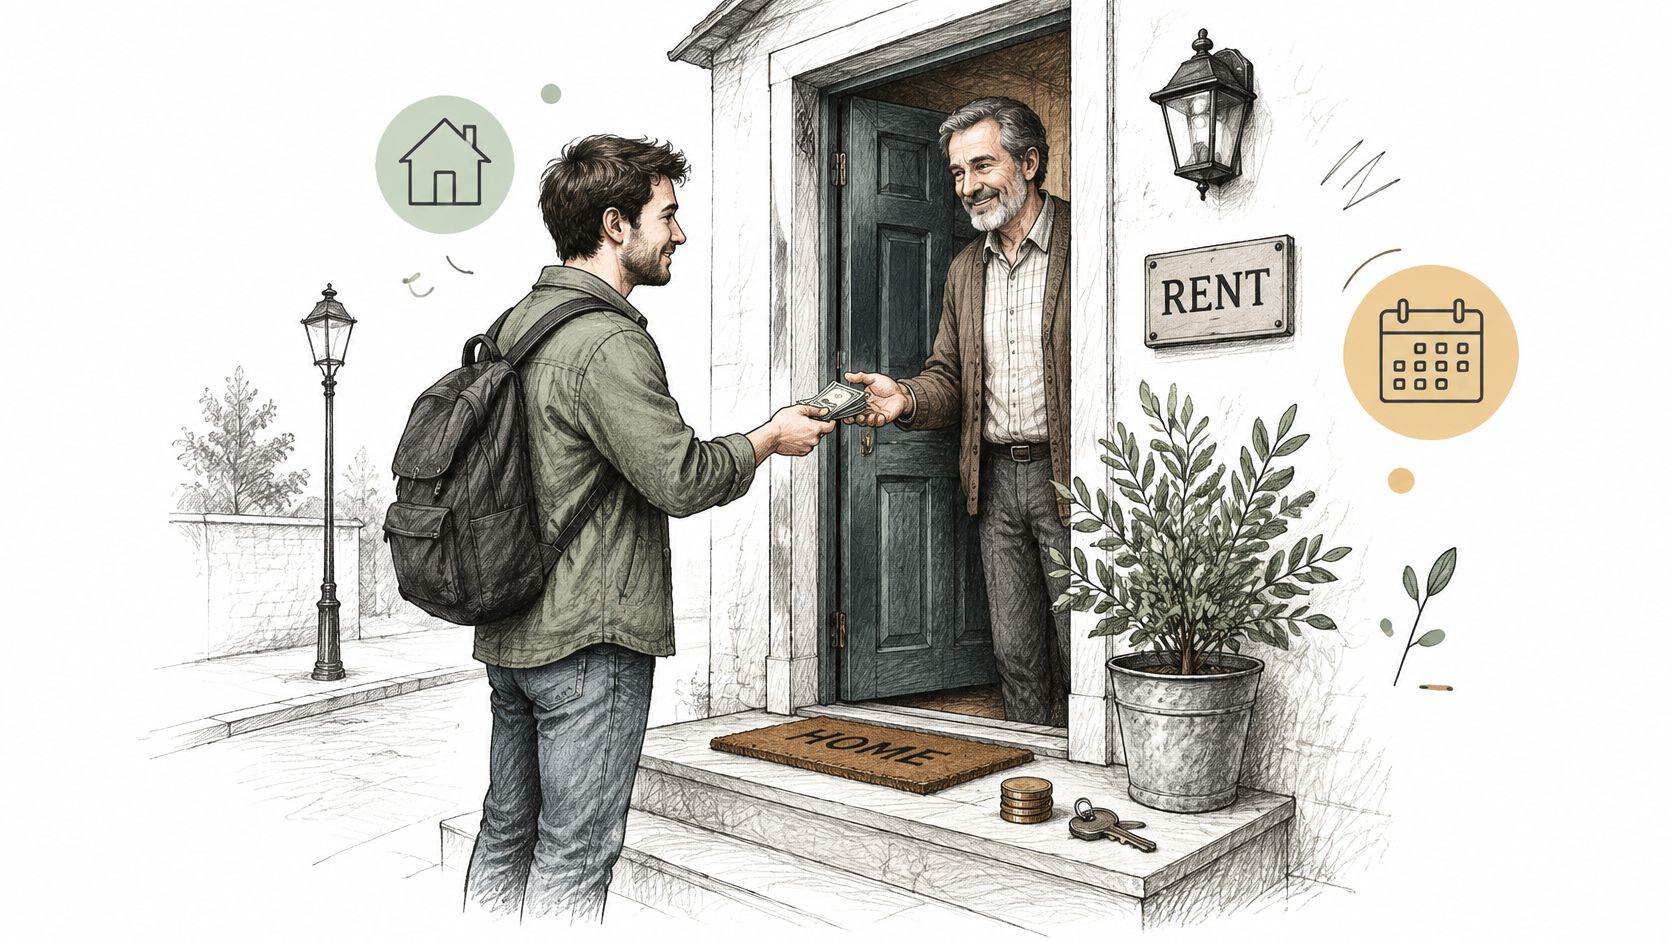
A rental property is the cleanest way to see what a customer is worth. You don't value the building by the deposit collected at signing. You value it by the rent it produces month after month, minus the mortgage, the repairs, and the weeks it sits empty.
A customer behaves the same way. The first order is the deposit. The repeat orders, the lower service cost of someone who already knows how to use the product, and the referrals they bring are the rent. An academic review of customer lifetime value defines it as the revenues generated over a customer's transaction lifetime minus the costs of acquiring, selling to, and servicing that customer. Read that subtraction carefully. It isn't first-order revenue with a multiplier bolted on. It's the net economic contribution of the entire relationship.
Every serious model, whether it's a spreadsheet or a stochastic forecast, is trying to estimate three things:
Modern models estimate all three together rather than assuming a customer lives forever at their average spend. The shift that matters for a store is philosophical before it's mathematical: you stop reporting revenue backwards and start allocating profitability forwards. Customers get ranked by expected contribution, acquisition spending gets compared with projected value, and lifecycle programs get judged on incremental future profit instead of opens and clicks.
Here's the picture in one frame.
That forward view is also where most of the errors enter. If your attribution is broken, a customer's first order gets credited to the wrong channel and the whole ranking shifts. Running journey analytics with reliable conversion data first is the difference between a CLV model and a confident guess.
What to do now: list the customer groups you already know you have (first-time buyers, repeat buyers, lapsed accounts, discount-driven buyers) and write down which raw numbers you'd need to pull for each. That inventory is the starting point, not a formula.
Three models dominate practice, and they answer different questions. Pick one before you run a single division, because the model determines which inputs you need and what the output is allowed to justify.
| Model | Core inputs | Best use | Main limitation |
|---|---|---|---|
| Revenue-based | Average order value, purchase frequency, lifespan | Quick board-level estimate | Ignores margin and cost-to-serve |
| Margin-adjusted | Gross margin, orders, lifespan, discount rate, service costs | Budgets and acquisition limits | Needs product-level cost data |
| Probability-based (Pareto/NBD, BG/NBD) | Purchase timing and repeat history per customer | Forecasting future purchases in stores without contracts | Needs a year or more of repeat transactions and modelling tools |
Revenue-based CLV is average order value times purchase frequency times lifespan. It takes twenty minutes and it fits on one slide. It also measures expected revenue rather than economic value, which is why it flatters everything it touches. The Shopify guide to customer lifetime value draws exactly this distinction, treating revenue-based CLV and margin-adjusted profit as two metrics answering different business questions.
The distortion isn't subtle. A frequent buyer of low-margin accessories can outrank an occasional buyer of high-margin core products, and a revenue ranking will send your retention budget to the customers whose repeat orders contribute least. That's a real misallocation, not a rounding error.
Margin-adjusted CLV subtracts product-level cost, discounts, refunds, fulfilment, support, loyalty incentives, retention-channel costs, and acquisition cost before it shows you a number. It's more work because you need a cost sheet that matches your accounting, not just an order export. In exchange, the output can carry a decision: a spend cap per customer, a payback target per channel, a break-even acquisition cost.
The question worth answering is narrow. Which customers deserve additional retention investment after variable costs, not which customers generate the most sales? Those two rankings disagree more often than store owners expect, and the gap between them is usually where the wasted budget sits.
Pareto/NBD and BG/NBD were built for noncontractual businesses, the kind where customers can stop buying without formally cancelling. They estimate, per customer, the chance they're still active and how many purchases to expect next, which is different from an average-lifespan assumption. They also need volume: at least a year of repeat transactions across enough customers to fit, plus the tooling to run it.
The decision rule I'd use: margin-adjusted CLV for anything that sets a budget or a spend cap, revenue-based CLV for quick comparisons between segments, and a probability model once you have 12 months or more of repeat order history and a reason to forecast individuals rather than averages.
One plumbing note. If your order data lives in a storefront, your costs live in an ERP, and your member data sits on a separate platform, joining them is infrastructure work before it's analysis. Teams scaling membership sites on AWS hit the same problem in a different context: the reporting is only as good as the joined data underneath it.
For everything that follows, the model is settled. Margin-adjusted, discounted, and built from a cohort with real history.
Five steps, in this order. Skipping any one of them is how a CLV figure ends up too high and an ad budget ends up too aggressive.
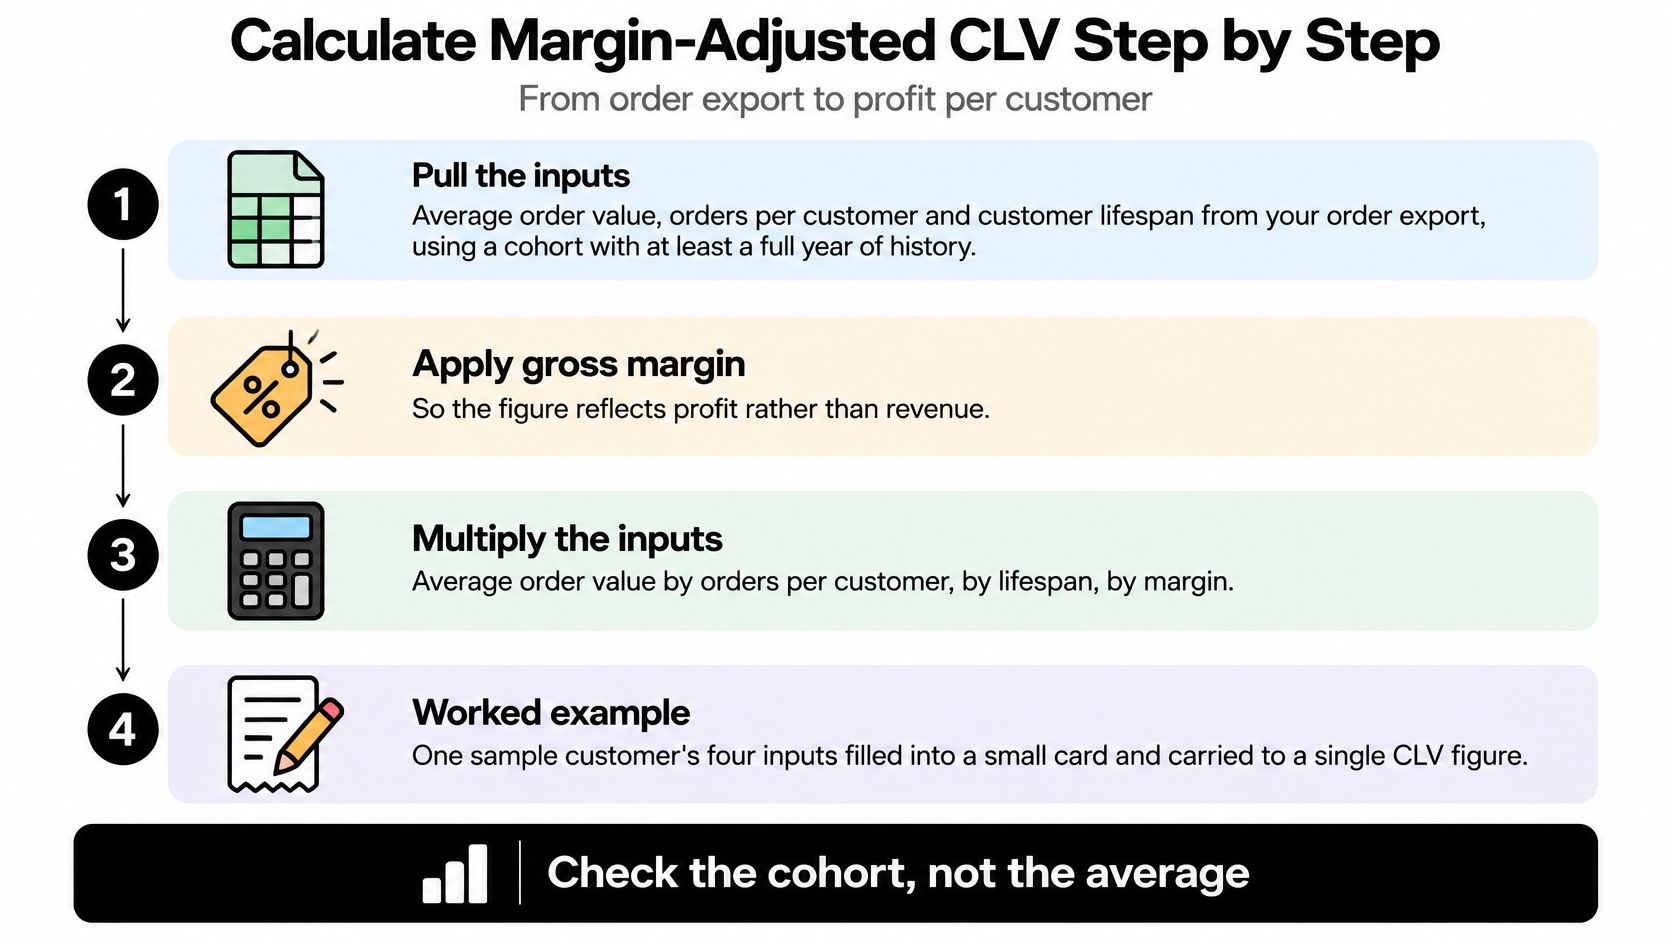
Pull the inputs from a cohort with at least 12 months of history. Average order value, orders per customer, and lifespan all come from the same export. Mixing customers acquired last month with customers acquired two years ago produces an average that describes nobody, because newer customers haven't had time to reveal their lifespan.
Convert to annual revenue per customer. Average order value times orders per year. This is the only step where revenue appears. Everything after it is margin.
Apply gross margin, removing product cost, discounts, refunds, and shipping subsidies. This is the step that changes conclusions. A 55% margin turns $150 of annual revenue into $82.50 of contribution, and a 30% margin turns the same $150 into $45. Two stores with identical order values can have CLV figures that differ by nearly half.
Discount future years at your cost of capital. An 8% to 12% band is standard for an established store. Divide year-one margin by 1.10, year-two margin by 1.21, year-three margin by 1.331 at a 10% rate, and you've converted three years of cash into today's money.
Subtract acquisition cost and cost to serve. Acquisition cost is ad spend divided by new customers for the same period. Cost to serve covers support contacts, returns processing, and the messaging platform that keeps the retention flow running.
Here's the arithmetic on a real-shaped example, and the process it follows.
| Input or result | Value | Source or calculation |
|---|---|---|
| Average order value | $60 | Order export, 12-month cohort |
| Orders per year | 2.5 | Orders divided by active years |
| Gross margin | 55% | Revenue minus product cost, discounts and refunds |
| Annual margin per customer | $82.50 | $60 × 2.5 × 55% |
| Three-year margin, discounted at 10% | $205 | $82.50 ÷ 1.10 + $82.50 ÷ 1.21 + $82.50 ÷ 1.331 |
| Acquisition cost | $60 | Paid ad spend divided by new customers |
| Net CLV after acquisition | $145 | $205 − $60 |
It's not a vanity metric. The $205 of discounted three-year margin is the most you can spend to acquire a comparable customer and still break even over three years. At $60 acquisition cost you have $145 of headroom, which means you can absorb a higher CPA on a channel that brings in better-than-average customers, and you can't on one that brings in worse.
Two adjustments change the answer materially. If you have less than 12 months of history, cap the lifespan at the period you've observed and label it, because a short history understates long-run value and will make you underinvest. And subtract returns before you calculate margin, not after, so the revenue line already reflects what stayed sold.
Cost to serve deserves its own pass rather than a flat percentage. A cost-to-serve analysis for growing businesses usually surfaces the same pattern: free shipping thresholds, frequent small orders, and generous return policies transfer margin from your best customers to your most expensive ones.
Once the number exists, it becomes usable. The practical levers that raise customer lifetime value all act on one of the four inputs, so you can rank them by how much margin each would add rather than by how easy each is to ship.
A single CLV figure describes your average customer, and your average customer doesn't exist. Cohort analysis fixes that by grouping customers by first purchase month and tracking cumulative margin per customer at months 1, 3, 6, and 12. Every cohort gets measured from its own month zero, which is what makes an 18-month-old group comparable to a 6-month-old one at the same age.
Payback is the first month where cumulative margin per customer crosses the acquisition cost line. That's the number to compare across cohorts, not total revenue. A cohort can generate plenty of revenue and still never pay back.
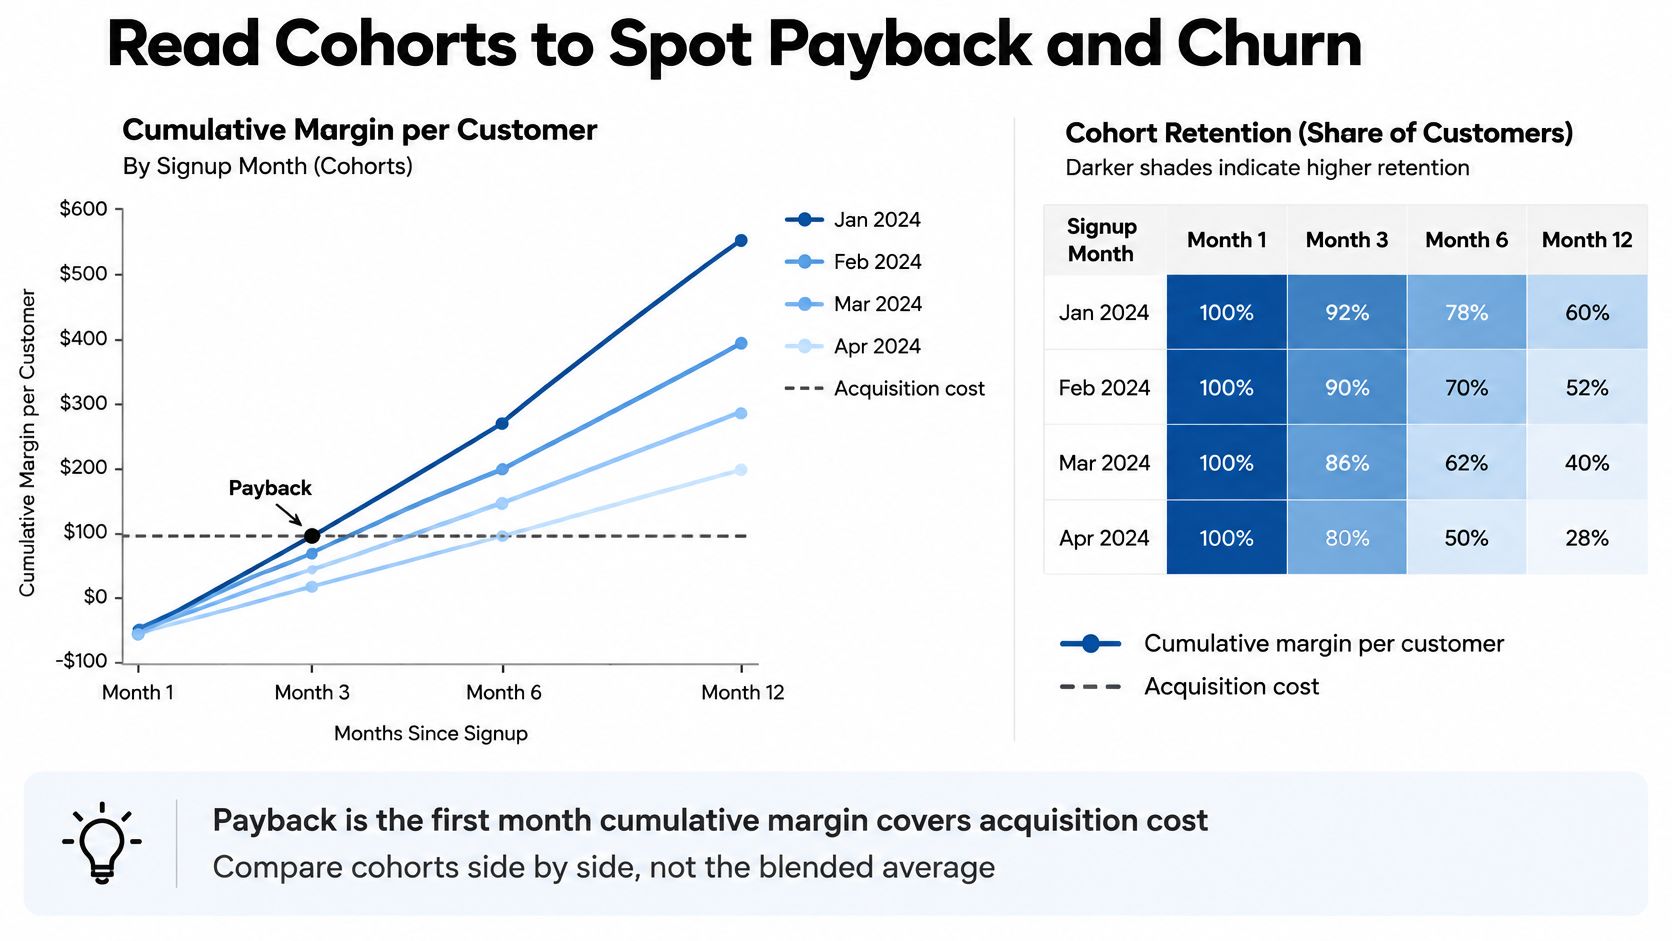
Flat after month two. The first purchase is the only purchase for most of the cohort. That's a second-order problem before it's an acquisition problem, and buying more traffic into it just adds names to a stalled curve. Look at what happens between order one and order two: delivery timing, onboarding email, the offer in the second message.
Still climbing past month six. Retained customers are compounding. This is the shape that justifies raising acquisition budgets, because the tail is doing the work. Protect it: don't cut the flows that feed it to fund a discount campaign.
Early drop, then recovery. Often a cohort bought on a holiday promotion. Before you conclude anything, compare that cohort's margin per order with full-price cohorts. A discount cohort that recovers to the same cumulative margin took more orders to get there, and that's a different business.
Watch how the same pattern reads once you put it on screen.
Compare cohorts at the same age, side by side. A blended average tells you the business is fine while one lane quietly loses money.
The decision at the end of this is small and specific: pick the cohort pattern that matches your store, then choose one acquisition channel or one onboarding change to test against it. Map that test to the customer lifecycle phases it affects, so the next cohort has something different to show.
Segmentation is where CLV stops being analysis and starts being a budget. Split customers by predicted margin and recent behavior, then give each group a spend rule expressed as a share of predicted margin, never a share of predicted revenue.
| Segment | Typical signal | Retention action | Spend limit |
|---|---|---|---|
| First-time purchasers | One order, under 60 days old | Welcome and second-purchase flow | Spend no more than the margin of their predicted second order |
| High-value repeat buyers | Three or more orders and above-median margin | Loyalty messages, replenishment reminders, early access | Protect margin and avoid blanket discounts |
| Dormant customers | No purchase for 180 or more days, high predicted churn | Win-back series with a single offer | Cap spend at a share of their remaining discounted CLV |
| Frequent low-margin buyers | High order count, below-average margin | Cross-sell higher-margin products | Limit discounts so each order stays margin-positive |
The fourth row is the one revenue rankings get wrong. A customer who orders nine times a year on low-margin products can sit near the top of a sales-based list and near the bottom of a margin-based one. Segmenting this way isn't theoretical; when we segmented the audience for Seat Cover Solutions, the working split was first-time purchasers, high-LTV customers, and dormant leads, which is the minimum viable set for a store of that shape.
For a first-time purchaser, the cap is the margin of their predicted second order. That's the entire expected return from the welcome flow, so a 20% welcome discount on a low-margin basket can consume the whole thing before the email has been read.
For a dormant customer, cap the win-back at a share of remaining discounted margin. One offer, not a three-step escalation of increasing discounts. If the customer only returns at 30% off, you've bought revenue, not value.
For a frequent low-margin buyer, audit the per-order economics after every discount is applied. A replenishment flow that attaches a code to each reorder can turn a profitable customer into a loss over twelve months, and nothing on the dashboard flags it.
The segmentation analysis behind these tiers is worth building deliberately rather than by exporting whatever fields the platform offers by default. Recency, frequency, and margin get you most of the way.
Practical rule: set the cap on discounted margin for the next 12 months, then keep total retention spend (messages, incentives, creative, platform fees) well under it. If a segment can't clear its own cost, it isn't a priority, whatever its revenue ranking says.
Put one number next to your CLV before you trust it: the acquisition cost of the same cohort. The ratio between the two is what makes CLV actionable. A common planning convention treats roughly 3 to 1 (lifetime margin against acquisition cost) as a starting filter. Below 2 to 1, acquisition is consuming most of the margin the customer generates, and any channel sitting at that level is a spend decision you can't afford to repeat. Well above 5 to 1 usually signals underinvestment: margin you could be spending to win more of the same customers. Treat the thresholds as filters for where to look first rather than pass/fail grades. A 2.5 to 1 segment with cheap retention levers can beat a 4 to 1 segment that only responds to discounts.

Retention economics are why CLV became a strategy conversation. Research summarized by Bain on loyalty and retention found that a 5% increase in customer retention was associated with profit increases ranging from 25% to 95%, depending on the industry and underlying economics. A separate Bain example reported that at MBNA, a 5% retention improvement increased profits by 60% by the fifth year. The mechanism is cumulative: acquisition costs are paid early, while repeat purchases, lower service costs, higher purchase volume, and referrals accrue.
That range is the point. A 25% to 95% spread means you can't budget from the headline number, because the size of the prize depends on your economics, not on the benchmark. Measure incremental margin from the extra orders, then compare it with messaging, incentive, fulfilment, and operational costs.
Retention also isn't an unconditional goal. Academic work cited in that same Bain analysis found the relationship between customer tenure and profitability can be weak, with correlations between 0.20 and 0.45 across settings. A long-tenured customer who only buys on promotion is not automatically a profitable one. The gap between acquisition and retention cost is real, but its size varies by industry, so build the comparison from your own acquisition spend and your own cost per retained order rather than borrowing a multiplier.
A retention program works when discounted future contribution rises. Opens, clicks, and send volume prove you sent something, not that you made money.
Four checks, then one test. A spreadsheet handles all of it.
The exercise usually ends with a short list of missing flows. Welcome, post-purchase, and win-back gaps surface first, and each one maps to a segment whose spend cap you've already calculated. Smart flows can increase repeat purchase rate by 20-60%, which is why sequencing carries as much weight as copy: the right message at the wrong point in the lifecycle is a discount you didn't need to give.
If you'd rather buy the build than staff it, our Custom Welcome Flow is a one-time $999 project, and the templates can be reused for future campaigns. Brands doing $50K to $100K a month typically fit the Flow Accelerator package at $4,250, which includes 60 days of post-launch support where we stay on to optimize against results rather than send volume. If the gaps sit in welcome, post-purchase, or win-back and you want them built and tuned against margin, a Klaviyo agency partner can take that on. It's one route among several, and the spreadsheet still decides whether it worked.
Confirm the numbers this month, choose one segment to test, and set its cap before anyone writes another email.
Most of the gap between a flat retention curve and a compounding one sits in flows nobody has built yet: the second-purchase sequence, the post-purchase check-in, the win-back that leads with something other than a discount. Class A Media builds those email and SMS systems as one-time projects rather than retainers, with flows designed around discounted margin per segment instead of send volume. If your own analysis has named the segment and set the cap, Class A Media can build the lifecycle flows that hit it.
Let's build retention system that drive predictable, scalable revenue - without ad spend, without retainers, without guesswork.


The Ultimate Ecommerce Email Marketing Agency
Get in touch: hello@classamedia.com