Blog post
Insights
Customer Segmentation Machine Learning: A Practical Guide
What if your best customers aren't the ones your rules say they are? Most brands decide who's a VIP before looking at the data, set a spend threshold, and call that segmentation. Customer segmentation machine learning flips that order. It finds groups in how people buy, then asks a tougher question: did treating each group differently create extra revenue you wouldn't have earned anyway? That second question is the one that matters, and it's the standard you'll use throughout this guide.
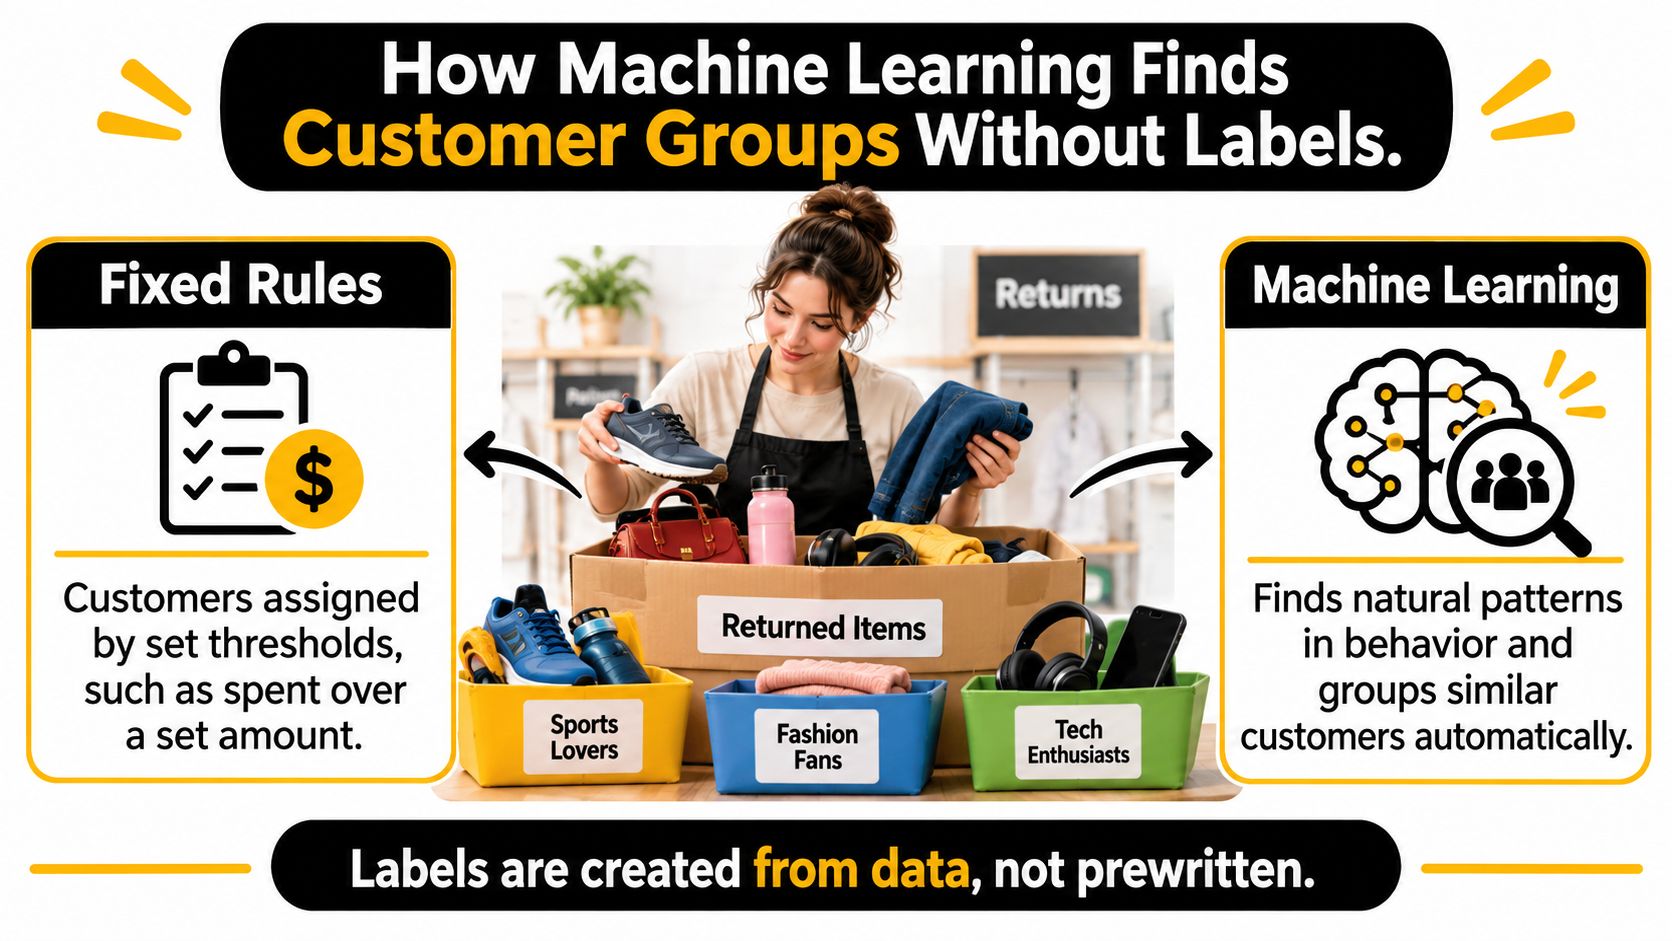
Think of a shopkeeper sorting a mixed box of returned items by what they have in common, not by a list of bins written in advance. That's unsupervised learning. No one hands the model correct answers. It looks for customers who resemble each other and groups them, and you name the groups afterward.
Fixed rules work the other way. You decide that spending over a set amount means VIP, then force everyone into bins you invented. Rules are easy to explain, but they can miss a repeat buyer with modest orders who's more valuable than a one time big spender.
Most ecommerce teams start with RFM, three behavioral numbers you can pull from order history.
An algorithm such as K-Means calculates an average profile for each group, called a centroid, then places each customer in the group whose profile is closest. It repeats that process until membership stops shifting much. No pre-labelled outcomes are needed because you're discovering structure, not predicting a known answer.
In a 2024 study of an online retail website operated by a UK retailer, the Springer chapter on K-Means clustering with RFM attributes used the elbow method and silhouette score to select the number of clusters and identified four customer clusters as the optimal solution. Each group then received different marketing recommendations based on its RFM profile.
Those groups became working audiences, such as recently active high-value customers, infrequent buyers, and customers whose purchase activity has declined. That's also the logic behind audience targeting with PlatformDTC, where a segment earns its place only when it changes who receives an offer.
A segment only matters if it leads to a different message, offer, or timing decision.
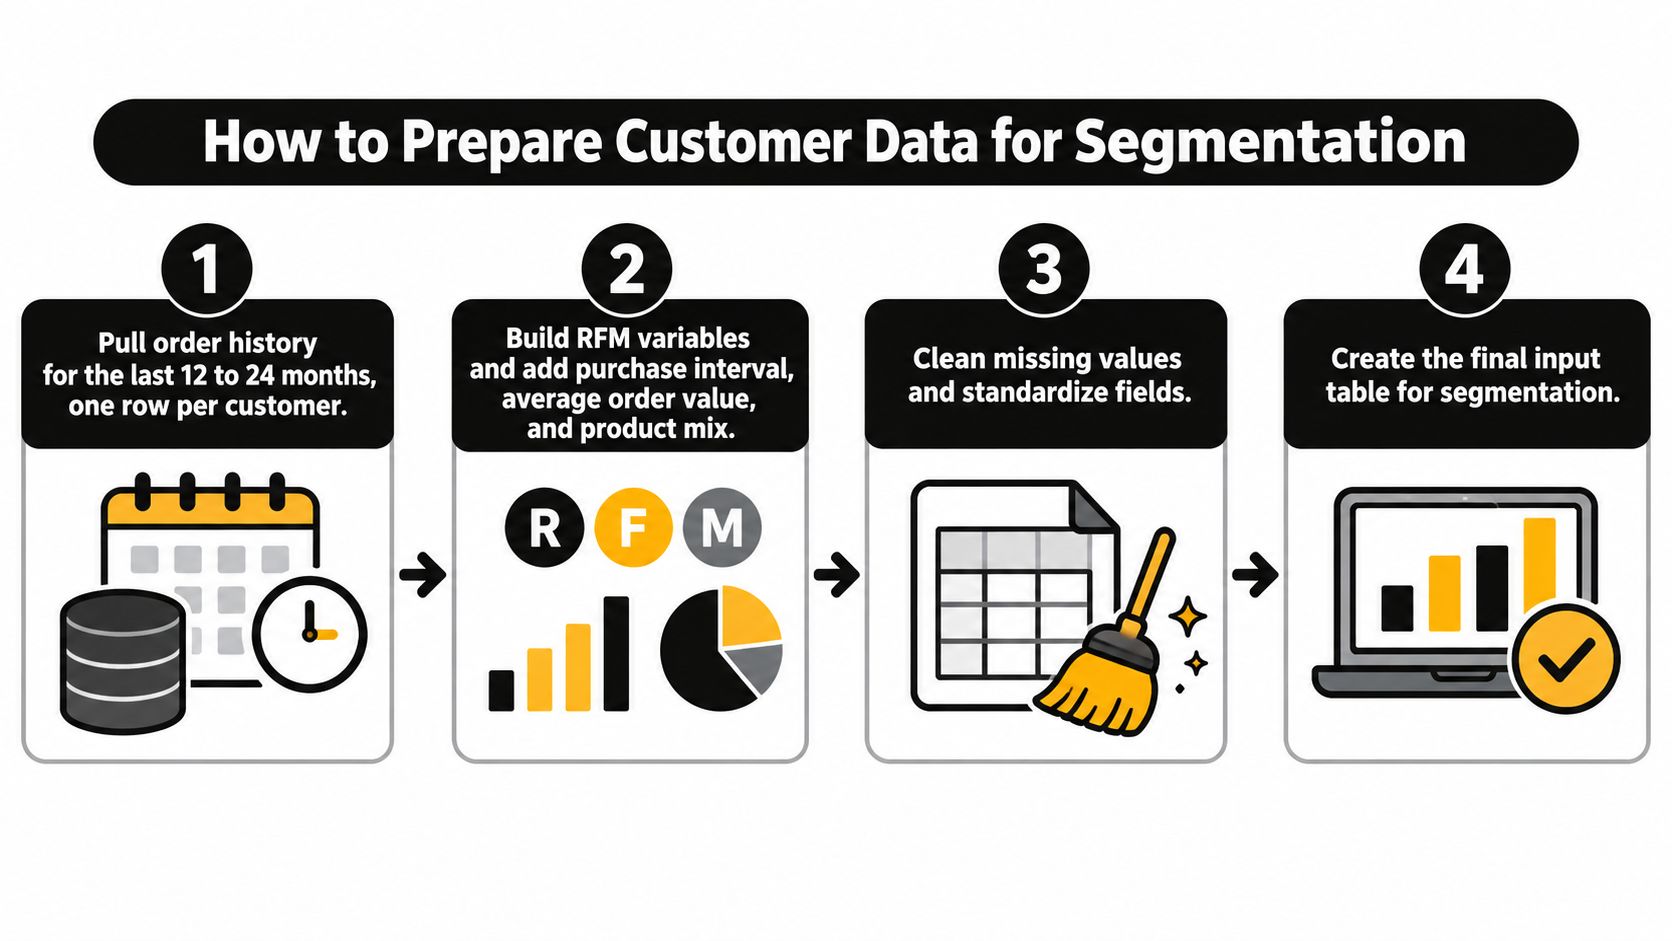
Start small. Pull recency, frequency, and spend for the last 12 months and run a first pass before adding more signals.
Clean inputs matter more than a clever algorithm. A model trained on duplicate accounts and refund orders will find patterns that don't exist, and you'll build flows for customers who aren't real.
The data cleaning discipline here mirrors work in other operational fields, including data-driven insights for logistics companies, where provenance and scaling decide whether analysis is usable. Connecting that table to your retention stack is covered in this guide to ecommerce and CRM integration.
Watch this walkthrough before you build your first table, then apply the governance checks below.
Opaque or stale signals can add compliance and reputational risk without improving repeat purchases. A 2025 SHS Conferences paper on data quality, privacy, and bias in segmentation describes a federated segmentation framework that reported a Silhouette Score of 0.631, within 6.1% of a centralized baseline, while reducing demographic-parity difference by 71.1% and membership-inference attack success by 30.9%.
You don't need federated learning to act on that lesson. Honor consent and opt-outs across every audience export, write human-readable reasons for each segment, and set expiry rules so old engagement stops driving decisions.
Pick a method by the job you need done, not by sophistication. The table below is a decision map. Most Shopify brands will live in the first row for months, and that's fine.
| Model | Needs labels | Best fit | Main limitation | Ecommerce use |
|---|---|---|---|---|
| K-Means | No | Large numeric RFM datasets | Assumes round clusters; sensitive to outliers | Four-group RFM split |
| Hierarchical clustering | No | Smaller datasets and nested segment review | Slow on very large data | Parent and sub-segment mapping |
| DBSCAN | No | Dense groups and unusual buyers | Hard to tune the distance setting | Flagging outlier accounts |
| Gaussian mixture models | No | Overlapping segments with soft membership | Needs enough data for stable fits | Probability of belonging to each segment |
| SVM, K-Nearest Neighbour, Naive Bayes | Yes | Assigning new customers to known segments | Needs labelled segments first | Automated flow triggers |
Practical rule: Choose the simplest method that produces segments you can name and act on, and move to a more complex option only when the simple one fails validation.
Two caveats deserve emphasis. K-Means assumes roughly round clusters, so long, stretched patterns in your data can get split awkwardly, and unscaled outliers will drag its centers. DBSCAN is sensitive to its distance setting, so a small tuning change can merge groups you wanted separate or label half your base as noise. Test settings on a sample, inspect who's in each group, and don't trust a result you can't describe in plain language to your email team.
Complexity has a maintenance cost too. Every extra parameter is something someone must retune when behavior shifts after a sale, a price change, or a new product launch. A simple model your team reruns monthly beats an intricate one nobody touches for a year.
A clustering model will always return groups, even from random data. That is the central trap. Your job isn't to get clusters out. It's to decide whether the clusters mean anything and whether they're worth separate treatment.
The elbow method plots within-group spread as you add clusters. Spread always falls, but you're looking for the bend where extra clusters stop helping much. Past that bend, you're slicing similar customers into thinner groups for little gain.
The silhouette score measures how closely each customer fits its own group compared with the nearest other group. Don't read one value in isolation. Compare scores across several cluster counts and favor the count where customers sit comfortably in their group and far from the next one.
Use this checklist before you accept any cluster count, and revisit it when you review your customer lifetime value model assumptions.
| Check | What it tests | Pass signal |
|---|---|---|
| Elbow method | Where adding clusters stops reducing within-group spread | A clear bend in the curve, not a smooth slope |
| Silhouette score | How closely each customer fits its own group versus the nearest other group | Highest score among the cluster counts tested |
| Resampling stability | Whether the same segments reappear on a different sample of customers | Similar groups and membership on repeated runs |
| Business test | Whether each segment supports a distinct message or offer | One named action per segment |
Run the model on different samples of customers. If the same segments and similar membership reappear, you've found real structure. If groups dissolve or swap members freely, the pattern is fragile and your flows will chase noise.
Then apply the stricter test. Each segment must support one named message, offer, or lifecycle path. If two segments would receive identical treatment, merge them. If one segment is too small to target or test, fold it into a neighbor.
Write one sentence naming each segment and its action before accepting the cluster count. If you can't write the sentence, you don't have a segment yet.
Over-splitting is seductive because it looks precise. In practice, it produces groups that are distinct on paper but too small to test, too similar to write separate copy for, and too numerous for anyone to maintain. Fewer, sturdier segments give you cleaner tests and clearer answers about what drives repeat purchases.
Clustering is a snapshot. It groups the customers you have today, but tomorrow a new buyer places a second order and your flows need to know where she belongs without rerunning the whole analysis. That's the step from grouping to prediction.
Once segments are named, those names become labels. A supervised classifier learns from labelled examples and assigns new or returning customers to the right segment automatically. This is what makes segment based email and SMS triggers practical at scale.
A study in the OPSEARCH journal described an RFM-RN framework that added Repurchasing Number (RN) to recency, frequency, and monetary value to capture repeat-purchase continuity. According to the OPSEARCH study of the RFM-RN framework, the research analyzed more than 1 million online-retail transactions, covering 4,383 customers and 4,481 products.
Its workflow combined several steps you'd recognize from careful data preparation.
The reported classification results were 97.9% accuracy, 96.8% precision, 96.1% recall, 96.4% F1-score, and 97.2% ROC-AUC, outperforming the study's conventional RFM and RFM-D comparisons.
Read those numbers with restraint. They depend on the dataset, feature definitions, time window, class balance, and validation design, so they are not universal benchmarks your store should expect to match. A model can also score well by learning quirks of one retailer's history that won't transfer to your catalog, price points, or purchase cycle.
The transferable lesson is narrower and more useful. Adding repeat-purchase and timing variables can make segments more useful for automated email and SMS decisions than spend alone, because replenishment timing tells you when to send, not just who is valuable.
Explainability step: For each predicted segment, output the top RFM-RN drivers in plain language, such as bought recently, orders monthly, repeat category buyer, so a marketer can see why a customer was assigned.
Monitor accuracy by market and cohort after launch. If performance drops for new customers or one region, you've caught drift or uneven treatment before automated flows amplify it. Retrain on recent data, recheck the labels, and confirm the segments still match how people buy now.
Segments don't make money. Different treatment does, and only when that treatment changes behavior. Start with flows where segment specific content is obviously different, not cosmetic.
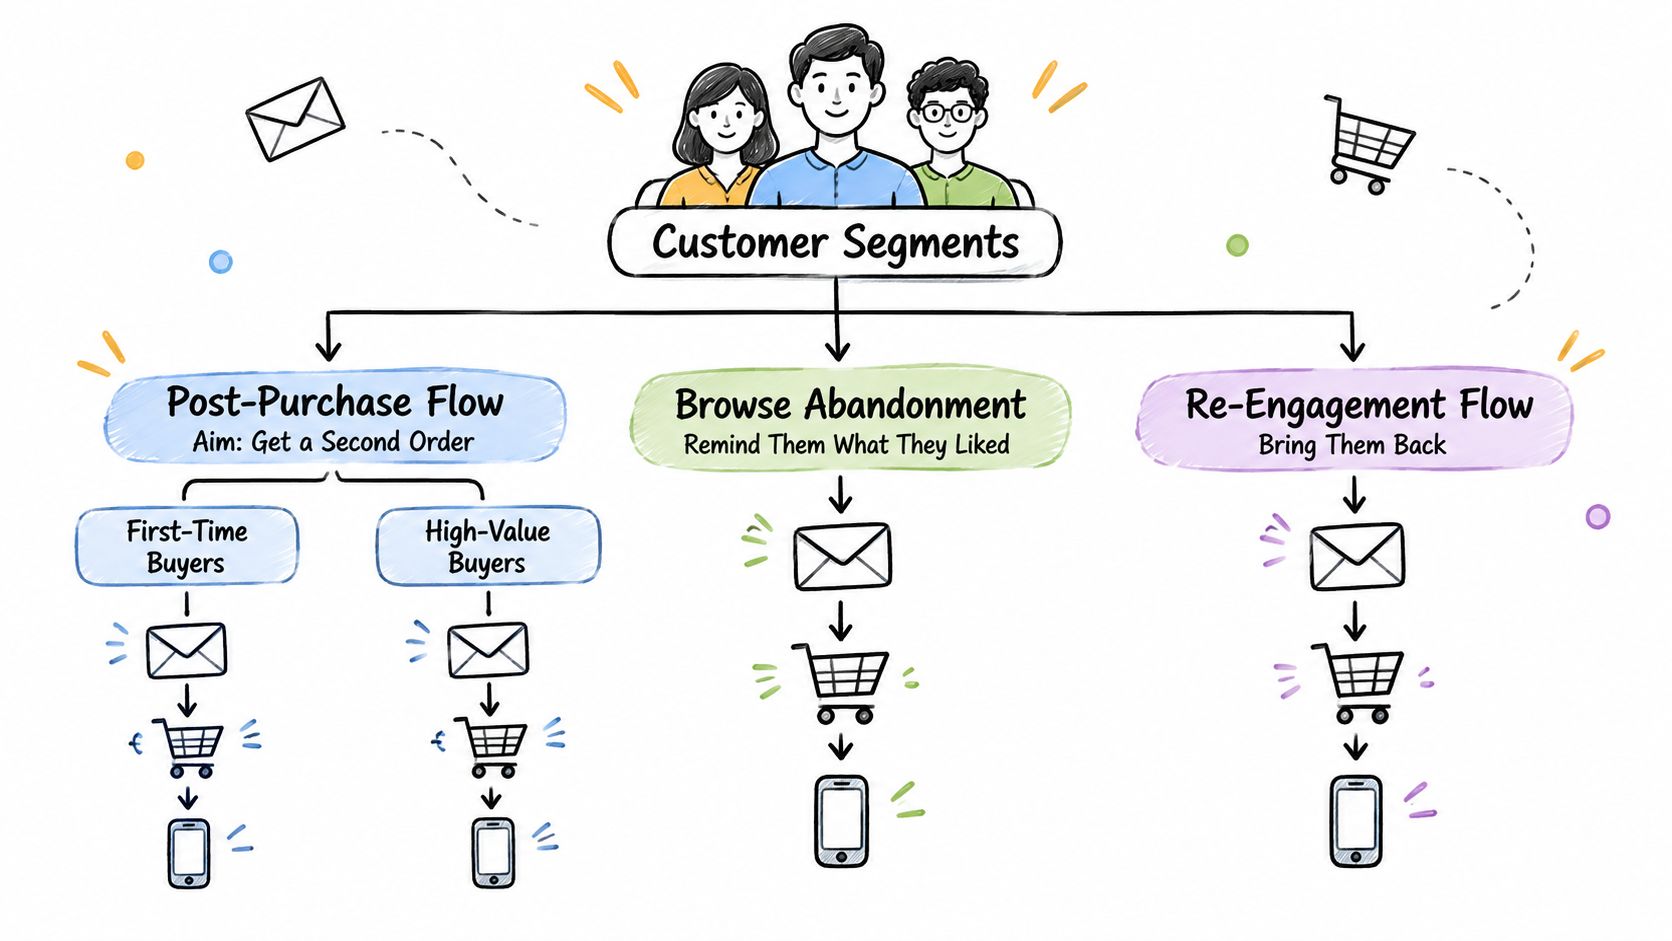
A post-purchase sequence should encourage a second order, but a first time buyer needs usage guidance and reassurance while a high-value repeat buyer needs early access or a relevant cross sell. We build post-purchase email sequences that encourage repeat purchases through loyalty-driven messaging, and segmenting that flow is where the copy earns its keep.
A browse or abandonment flow should respond to the specific action taken, with timely reminders and curated suggestions tied to what was viewed. For high-ticket products, use an education-first flow that moves prospects from discovery to decision with comparisons, proof, and objection handling rather than an immediate discount.
The audience logic can be simple at this stage. For Seat Cover Solutions, the audience was segmented into first-time purchasers, high-LTV customers, and dormant leads. Three groups, three treatments, and a test a small team can run. Broader measurement context is available in Cometly's customer segmentation guide and in this breakdown of email marketing conversion rate benchmarks and drivers.
Open rates and click rates cannot prove a segment works. High-intent customers were already more likely to buy, so targeting them and claiming the sales is circular. You'll look successful while creating nothing.
Measure against a randomized holdout that receives no segment specific flow. Shopify's guidance on increasing repeat purchases recommends tracking conversion lift against control, AOV, 90-day retention, predicted-versus-actual LTV accuracy, and segment migration, not engagement alone.
Add discount dependence and contribution margin to that list. A segment that lifts orders only by training customers to wait for codes hasn't improved retention. It has rented revenue at a margin cost you'll pay every cycle.
The counterintuitive point emerges here. A less accurate but actionable segment can outperform a technically superior model when it finds persuadable customers, people whose behavior your message can change. A flawless model that identifies certain buyers adds little if they would have purchased anyway.
Resist scaling a segment that hasn't beaten its holdout. Adding more groups multiplies creative work and muddies attribution, while one proven segment gives you a template for the next test. Growth comes from stacking validated treatments, not from a impressive cluster chart.
That's the honest promise of customer segmentation machine learning. It won't tell you what to say, and it can't prove its own value. It gives you defensible groups, a way to assign new customers to them, and a clean test of whether different treatment earns incremental revenue. Judge it by that test and you'll keep the segments that pay.
Class A Media offers done-for-you email flows built to convert, with segmentation and automation designed around repeat purchases rather than engagement for its own sake. If you want segment based flows tested against real revenue outcomes, schedule a consultation to get a custom plan for your brand. Visit Class A Media to start the conversation.
Let's build retention system that drive predictable, scalable revenue - without ad spend, without retainers, without guesswork.


The Ultimate Ecommerce Email Marketing Agency
Get in touch: hello@classamedia.com