Blog post
Insights
Customer Lifetime Value Model: How to Choose

The most popular advice treats a customer lifetime value model as one multiplication: average order value times purchase frequency times lifespan. That product answers only how much revenue might arrive if yesterday's averages keep repeating. It does not say whether those orders cover product, shipping, fees, returns, and the ads that bought the customer. It also does not say whether an email or SMS flow created any of the second orders.
A usable model is a forecast you can spend against, not a vanity total. Keep three figures apart. Revenue CLV is expected sales. Contribution-margin CLV is what remains after the cost stack. Incremental CLV is the extra contribution from one action versus a credible control. You choose the model by the decision in front of you, whether that decision is a bid cap, a retention budget, or a flow test.
A customer lifetime value model is a structured forecast of what a customer relationship is worth, built so a team can fund acquisition or retention. The popular formula stops at revenue. It never asks how much profitable, incremental value a retention action will create.
In 2024, the average ecommerce customer-retention rate was 27.4% across more than 100 retailers and seven retail categories, according to Bluecore's 2025 Customer Growth Benchmarks Report. Most buyers never become a long relationship. A blended lifespan that treats every first order as a multi-year annuity will overstate what you can pay to acquire or keep them.
Hold these three numbers apart, and do not collapse them into one dashboard tile.
The practical menu is a historic average, cohort windows, a margin-adjusted stack, a predictive score, or an incremental test. The formula should follow the decision. A bid cap needs margin. A retention budget needs a test. A first sketch can live with a historic average, labeled as revenue only.
Practical rule: If the number will change a spend decision this month, revenue alone is the wrong answer.
Read the table by the decision, not by how advanced the math looks. A thin first-year file does not become trustworthy because you added a probability distribution. A huge order history still cannot justify a flow if you never held anyone out.
| Model | Calculation idea | Key inputs | Core assumption | Use it when |
|---|---|---|---|---|
| Historic average | AOV × frequency × lifespan | Average order value, orders per year, active years | The past average continues | You need a quick benchmark and repeat behavior is stable |
| Cohort, time-bound | Value inside 30, 90 and 180 day windows | Acquisition source, product, geography, first-order behavior | Recent cohorts resemble the next ones | The base is mostly first-time buyers or channels differ |
| Margin-adjusted | Revenue minus cost stack and acquisition cost | Margin, fulfillment, fees, discounts, returns, support, CAC | Cost rates stay roughly stable | You will spend against the number, especially fashion, wellness or consumables |
| Predictive | Expected future orders from purchase history | Recency, frequency, monetary value, tenure | Behavior follows a stable distribution | You have a large order history, not a thin first-year file |
| Incremental | Exposed customers minus a holdout | Treatment, control, unsubscribes, discount cost | The control is comparable | You must know whether a flow or offer created value |
Historic average. Multiply average order value, orders per year, and active years. Use it as a benchmark when the catalog and the repeat rate have been steady for several seasons. Leave it the moment a new hero SKU, a subscription, or a paid-social spike changes who is buying. A single blended lifespan is unsafe when most buyers never order twice, because the loyal minority pulls the average up.
Cohort, time-bound. Estimate value at 30, 90, and 180 days by acquisition source, first product, geography, and what the first order looked like. This is the right row when Meta buyers and email buyers do not behave alike, or when the file is mostly people who have ordered once. The assumption that breaks it is a sudden offer change that makes last quarter's cohorts a poor stand-in for next quarter.
Margin-adjusted. Start from revenue and subtract product cost, fulfillment, payment fees, discounts, returns, support, and acquisition cost once per customer. Treat this as the minimum before you raise a bid or a retention budget, especially in fashion, wellness, and consumables, where shipping and returns move the profit. Stable cost rates are the fragile assumption. A carrier increase or a heavier discount calendar makes yesterday's margin stale.
Predictive. Score who is likely to buy again from recency, frequency, monetary value, and tenure, once the order history is large enough for a distribution rather than a handful of repeats. Put the score on top of cohorts. Do not let it replace margin. A high predicted repurchase rate on a money-losing SKU is still a bad customer to chase.
Incremental. Compare customers exposed to a flow or offer with a holdout that was eligible for the same treatment. This is the only row that can justify a retention program, because returning orders can happen with no message at all. The control has to be comparable. A holdout of people who already unsubscribed is not a control.
Switch on this rule. Use the historic average for a first sketch. Use cohorts plus margin before you change ad bids. Use an incremental test before you claim email or SMS created the repeat orders.
Treat the model as a stack of choices. Two analysts who cannot list the same inclusions do not have the same model, even when both call the output CLV.
| Input | How to treat it | If you omit it |
|---|---|---|
| Average order value | Net revenue per order after discounts | Promo buyers look as valuable as full-price buyers |
| Purchase frequency | Orders per customer inside a fixed window | One-time buyers are blended with loyalists |
| Lifespan or horizon | A window you will observe, such as 12 months | The model invents years you cannot observe |
| Product margin | Revenue after cost of goods | Revenue is treated as profit |
| Fulfillment and payment fees | Per-order shipping, pick-pack and processor fees | Heavy-shipping brands look more profitable |
| Returns | Reverse revenue and recoverable cost at the return rate | Fashion and fit-sensitive catalogs are overstated |
| Discounts and credits | Net them from the order, and track dependency | Coupon-driven repeats look organic |
| Acquisition cost | Subtract once per acquired customer | Retention and ads appear to have a free customer |
| Support cost | Allocate service cost to high-touch customers | Complex products look as cheap as simple ones |
Average order value should be net of discounts and store credit. A wellness brand running 20% off sitewide will look richer than a full-price brand if you use list price. Purchase frequency is orders per active customer inside a window you state, such as orders in 180 days. Do not average a one-time buyer with a subscriber and call the blend "typical."
Lifespan is the place most models cheat. Pick a horizon you will watch, often 12 months for replenishment goods, and stop. An invented five-year life turns a first order into profit you may never see. Product margin comes after cost of goods. If you skip it, you are modeling sales, not contribution.
Fulfillment and payment fees belong on every order. A catalog that subsidizes shipping inflates value the moment you leave the $7 or $9 pick-pack and label off the stack. Returns reverse revenue and only the costs you can recover. Apparel and fit-sensitive sizes are the usual victims of a revenue-only view.
Discounts get netted from the order, and you should also track whether the second order required a code. Acquisition cost is subtracted once per customer, not once per order. Spreading CAC across imagined future orders makes ads look free. Support cost matters for high-ticket goods and subscriptions, where tickets cluster on a few buyers.
A strong customer context for personalized support record is what lets you allocate that service cost to the customers who open tickets, instead of smearing one average across the file. The same file should already support ecommerce customer segmentation, so a high-touch buyer is not scored like a simple replenishment buyer.
Write these next to any figure you publish.
If two people on the team cannot list the same inclusions, stop the budget meeting and fix the definition before you argue about the dollar figure.
The base formula is average order value times purchase frequency times lifespan, discounted to present value over a fixed horizon. Label that result revenue CLV only. Shopify's guidance on overhauling the customer acquisition model recommends a margin-adjusted version that also brings in purchase value, frequency, lifespan, fulfillment costs, and acquisition costs. That matters for fashion, wellness, and consumables, where returns, shipping, subscriptions, discounting, and replenishment change contribution profit.
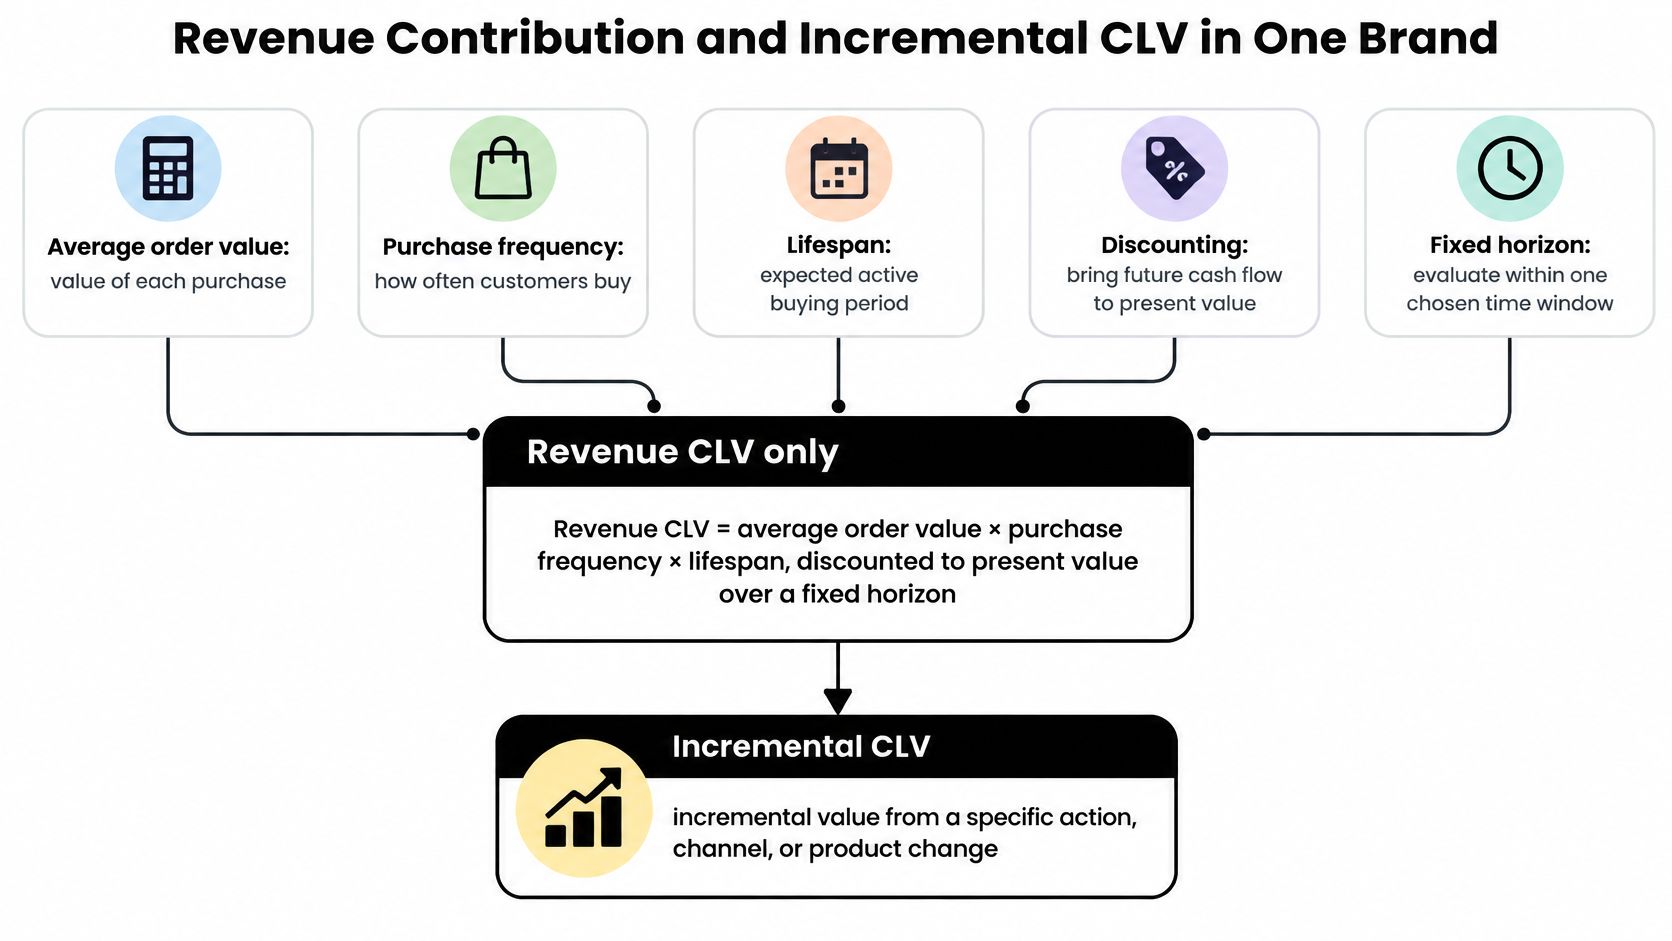
Say a Shopify wellness brand sells a consumable with a $64 first order and a natural 70-day replenishment. Paid social supplies a large first-order cohort. Discount future orders lightly, and keep the horizon at 180 days so you are not inventing year three.
Revenue CLV. In this sketch, 60% buy once at $64 and 40% place one reorder at $58 net. Expected revenue is about $87 across 1.4 expected orders. That is the revenue figure. It is not a bid.
Contribution-margin CLV. Product cost at 35% is about $30.50 on the expected revenue. Fulfillment at $7 per order is about $9.80 across 1.4 orders. Payment fees at 2.9% are about $2.50, with the small fixed fee left out for simplicity. Returns at 6% take about $5.20. Support is $4. That leaves about $35 before a $22 acquisition cost, so contribution CLV is about $13. A higher bid is not justified. Revenue of $87 looked roomy. Thirteen dollars of contribution does not.
Incremental CLV. A replenishment flow is tested against a holdout. Exposed customers show about $11 more contribution than the control. Messages plus a modest offer cost $3. Incremental CLV is about $8. Keep the flow. Leave the acquisition bid where the contribution math put it. Do not attribute every reorder to the automation. People on a 70-day cycle repurchase without a reminder.
The naive formula, $64 times 2 orders times 2 years, prints $256. That number invites overspending on both ads and retention, because it skips margin, skips the fact that most of this cohort orders once, and credits the brand with years it has not observed.
A short walk-through of how contribution and payback should bound acquisition sits in this overview.
A subscriber needs a cancel curve, not a flat reorder rate. Churn in month two is not the same as churn in month eight. A gift buyer should not inherit replenishment timing, because the purchaser is not the user. A high-return size gets scored on contribution, not on the revenue it briefly showed before the return landed.
Publish the three figures side by side before anyone changes spend: about $87 revenue CLV, about $13 contribution CLV after acquisition cost, and about $8 incremental CLV from the tested flow.
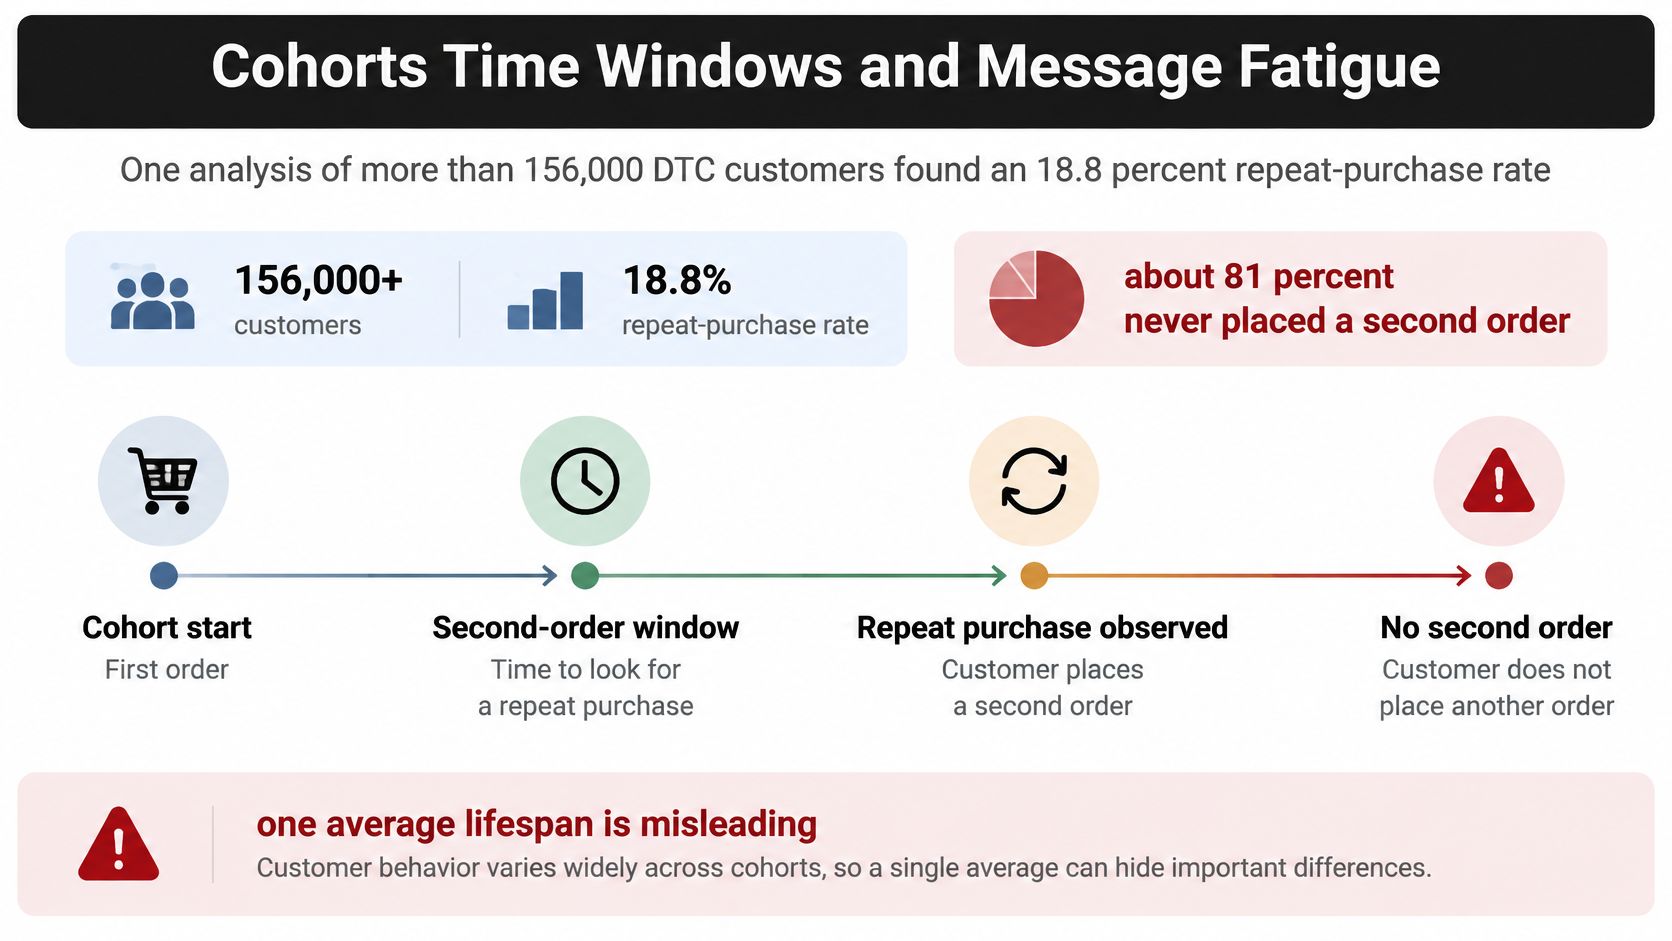
One analysis of more than 156,000 DTC customers found an 18.8% repeat-purchase rate, meaning roughly 81% did not place a second order, a gap Shopify's ecommerce retention guidance uses to show why one average lifespan misleads brands with a large first-order cohort. First-time buyers, repeat buyers, high-return customers, seasonal shoppers, and replenishment customers do not share a life.
Inside the base, keep behavioral segments separate so a dormant lead does not inherit a loyal customer's frequency. For Seat Cover Solutions, the audience was segmented into first-time purchasers, high-LTV customers, and dormant leads. That split stops the model from giving a quiet lead the reorder rate of someone who already bought twice. The same idea belongs in how you map customer lifecycle phases: a first purchase, a replenishment window, and a lapse are different jobs for the message.
Subscription brands need an extra cut by start month and plan, because cancel risk is not flat. Suby's subscription cohort analysis playbook is a useful companion when the reorder is a renewal rather than a one-off second cart.
More email can lower long-run value through unsubscribes, complaints, or discount dependency. One field-experiment report estimated that a less frequent email cadence could improve modeled full CLV by 8.3% versus daily sending, or 4.5% when coupon budgets were held constant.
Track three operational signals next to any cadence test.
The question is not "what is our CLV?" It is which intervention raises incremental, unsubsidized value without damaging the next quarter's ability to reach the same people.
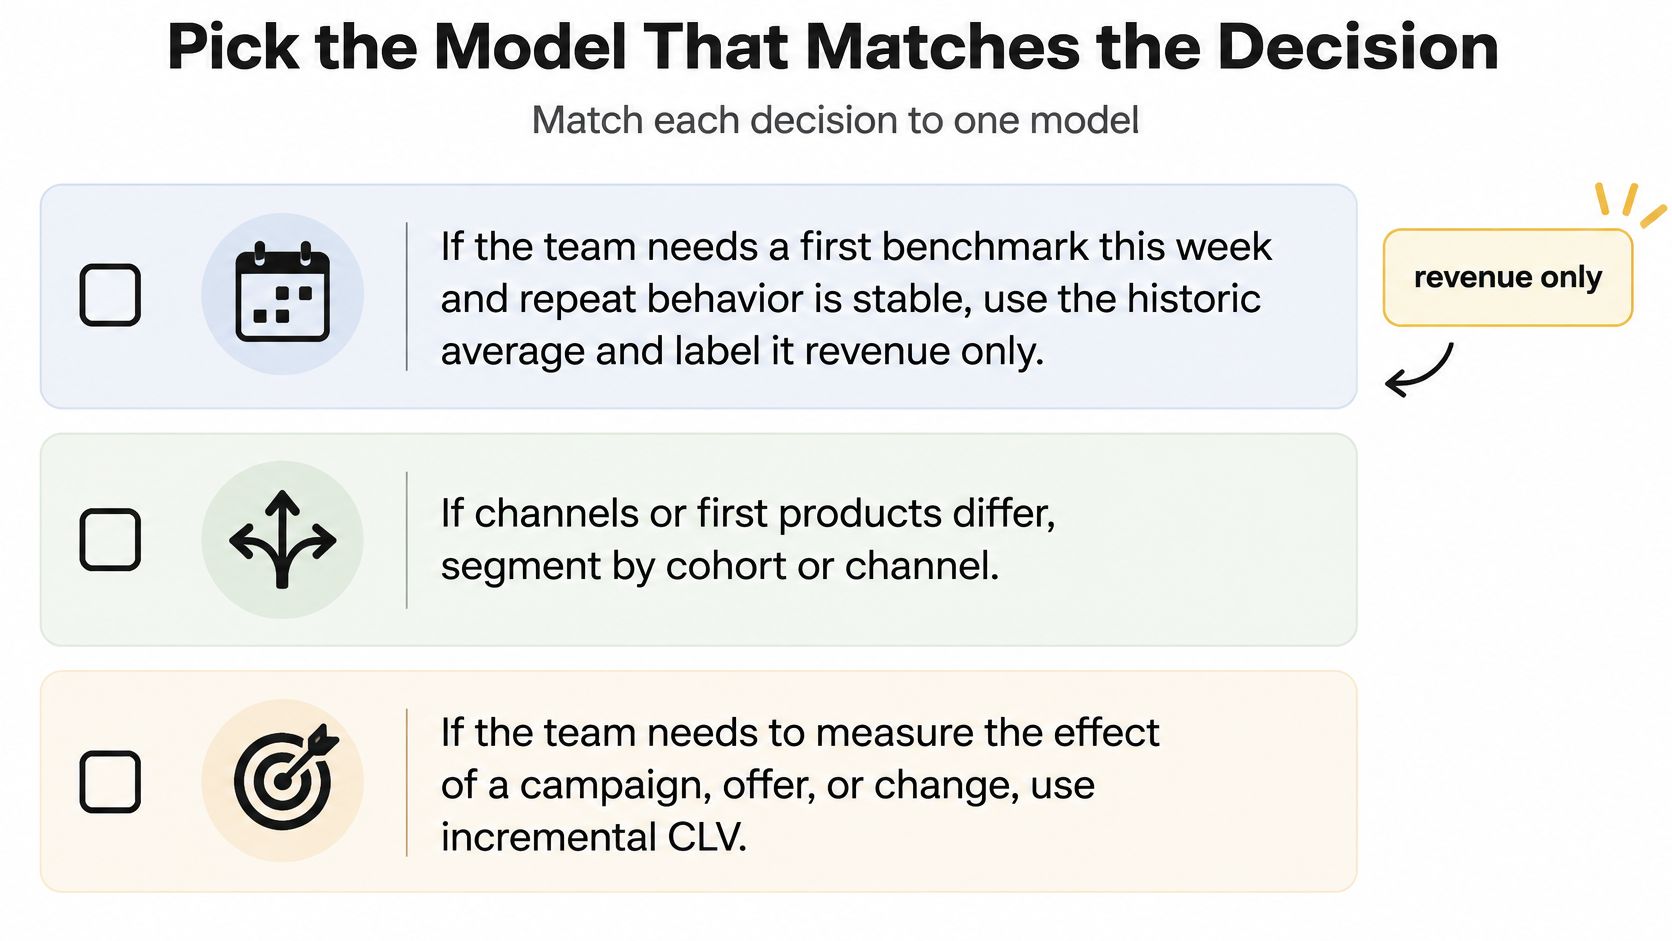
Match the decision to one row, then stop. Stacking every method into one number hides which assumption you are betting on.
Stop rule: do not scale a flow that lifts repeat revenue while contribution or incremental value is flat or negative. Smart flows can increase repeat purchase rate by 20 to 60%, but only the holdout tells you whether that lift survived margin, offer cost, and people leaving the list. The practical next step is still a test, not a bigger send. We build retention systems without ad spend and without retainers, so the model has to show that existing customers, not a new media budget, are carrying the gain.
Before the next budget meeting, publish the three values, the horizon, and the cost inclusions in one place. If you are choosing the stack that will run the flows, a clear roundup of the best apps for Shopify helps you see which tools can hold a holdout and a cohort view, not only a revenue total. Pair that with a plan for how to increase customer lifetime value that spends against contribution and incremental results, not against the naive product of order value, frequency, and an invented lifespan.
Class A Media builds custom email and SMS retention systems for Shopify brands, with lifecycle flows aimed at repeat purchase and contribution, not open rates alone. We have built those systems for over 200 ecommerce brands, and the work is a one-time build rather than a retainer that assumes the model never has to be re-read. If you want the three CLV numbers, the horizon, and the flows tested against a holdout, visit Class A Media.
Let's build retention system that drive predictable, scalable revenue - without ad spend, without retainers, without guesswork.


The Ultimate Ecommerce Email Marketing Agency
Get in touch: hello@classamedia.com