Blog post
Insights
Customer Lifetime Calculation: Formula and Worked Example
The most repeated piece of customer lifetime advice is a multiplication problem. Multiply average order value by purchase frequency by customer lifespan, the guides say, then treat the result as permission to spend. I'd argue with the last step before arguing with the formula. The product of those three numbers is revenue, and revenue is the one figure you can't reinvest.
Run the arithmetic on a typical store and it looks generous. A $60 average order value, 2.5 orders per customer per year, and a three-year lifespan returns $450 per customer. That's worth knowing. It's also, once product cost, payment fees, shipping subsidies, returns and discounts come out, closer to a third of the money you have to work with. And the three-year lifespan is doing a lot of unexamined work.
Customer lifetime value = average order value × purchase frequency × customer lifespan
Feed the three inputs into that line and you get $450. Each input answers a different question, and mismatching the units is the fastest way to a wrong answer.
Average order value is revenue divided by the number of orders. Use net revenue, after refunds, or you're inflating the first input before you've done anything else.
Purchase frequency is orders per customer per year. Not per month, not per quarter, and not per active customer. Total orders divided by unique customers, then divided by the years in the window.
Customer lifespan is the average number of years a customer keeps buying, measured from first order to last. The common shortcut of 1 ÷ churn rate carries a specific failure mode that the next section unpacks.
Inputs for the customer lifetime calculation
| Input | What It Measures | Where to Find It |
|---|---|---|
| Average order value | Revenue divided by number of orders | Shopify analytics or order export |
| Purchase frequency | Orders per customer per year | Customer export grouped by year |
| Customer lifespan | Average years from first to last order | Cohort report by first-purchase month |
All three inputs must speak the same time unit. A monthly frequency of 0.21 orders multiplied by a yearly lifespan of 3 gives nonsense. Convert first: 0.21 orders per month times 36 months times $60 still lands at $450, because the underlying truth didn't change, only the labels did.
The formula also assumes purchasing stays flat. It assumes the customer who bought twice last year will buy twice next year, at the same value, with the same discounting. That assumption is testable, and the cohorts below are how you test it.
Before you move on, pull three numbers for your own store: net revenue after refunds, total orders, and unique customers with their first and last order dates. Without that trio you're estimating, not calculating.
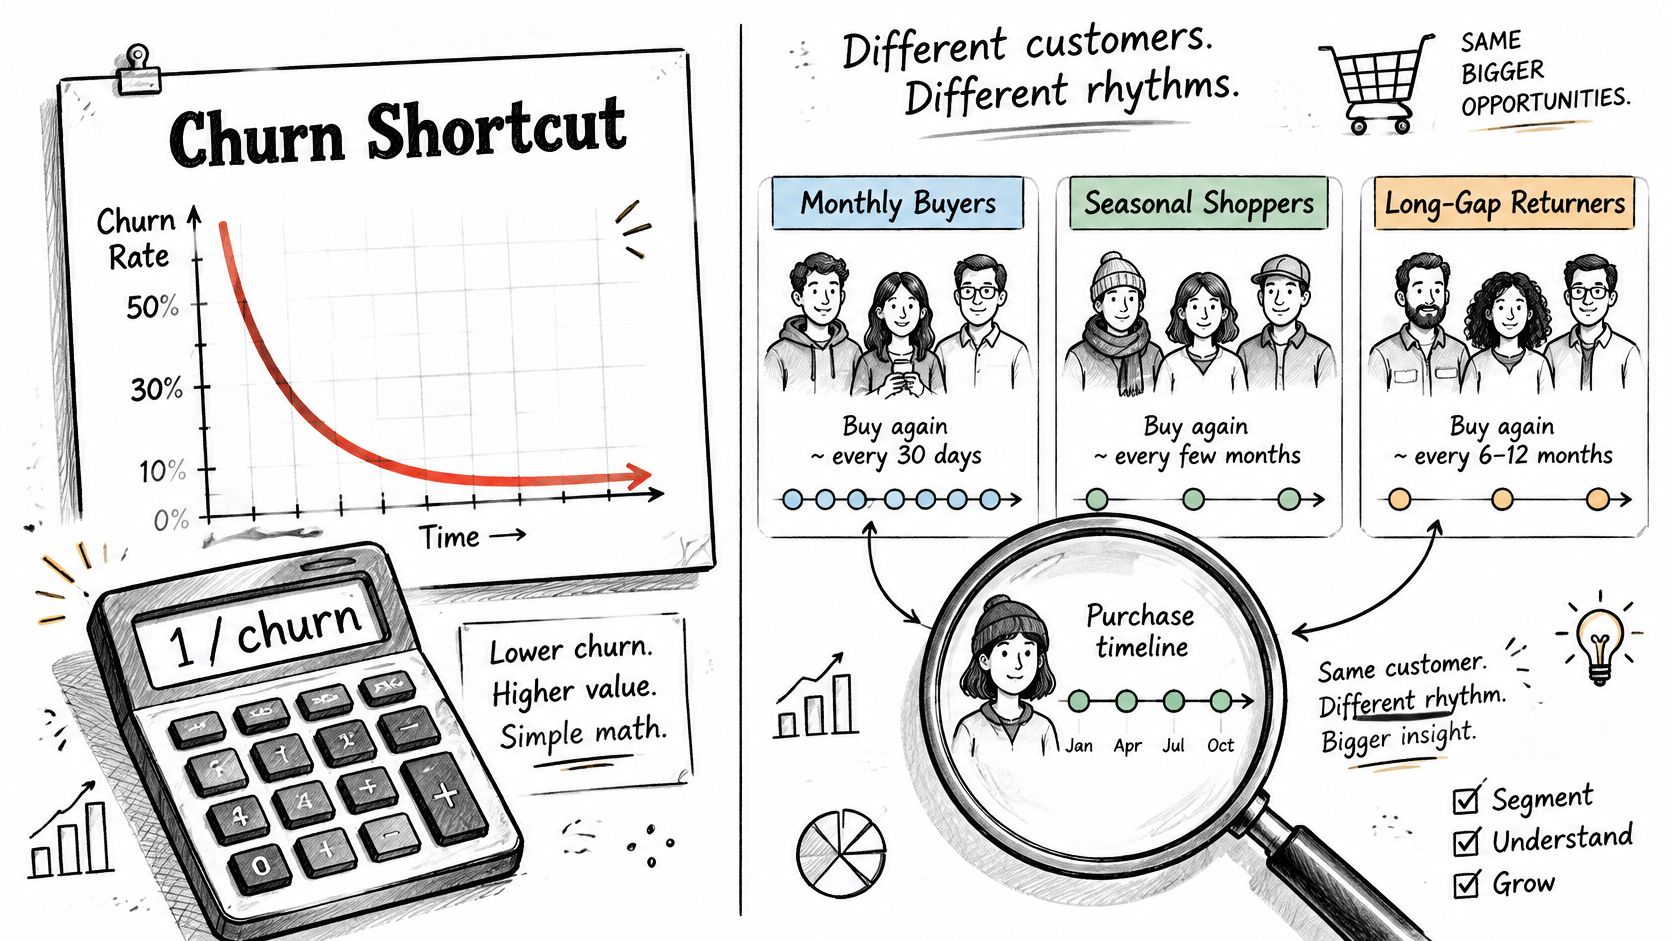
The 1 ÷ churn shortcut comes from subscription billing, where a customer either renews this month or cancels. The SaaS retention strategies for 2026 playbook is built on exactly that premise: a defined renewal event, a measurable cancellation rate, and onboarding designed to protect both. Retail has no renewal event. Customers buy seasonally, replenish at different speeds by product, drift between categories, and go quiet for five months before ordering again.
Shopify's enterprise guidance on ecommerce customer retention reflects that messiness. It treats time to second purchase, repeat purchase rate, purchase frequency and cohort retention as separate decision metrics rather than folding them into one blended CLV figure. Its survey data shows 77% of store owners track sales or total revenue, while fewer than half track average order value, which means many stores never collect the inputs the formula needs in the first place.
So split the base. Group customers by first-purchase month, by acquisition source, by the product they bought first, and by the gap between order one and order two. Each split produces a different lifespan, and each one is more honest than the global average.
The payoff grows with each order. A benchmark summary of repeat purchasing reported that a shopper who has bought once has a 27% chance of buying again, rising to 49% after a second purchase and 62% after a third, per the customer retention statistics collected by CartFlows.
| Orders Placed | Chance of Buying Again |
|---|---|
| One order | 27% |
| Two orders | 49% |
| Three orders | 62% |
That table is the argument for spending on the second order rather than the tenth. A single lifespan number hides it.
Read the cohorts on contribution, not revenue. A cohort that reorders only on deep discount can look loyal while contributing less per order than one that buys once at full price. Subtract the costs that attach to each customer, discount depth, shipping subsidy, return rate, before you call a cohort valuable. Consumables and supplements sit closest to recurring revenue, so their reorder windows are predictable enough to borrow churn-style logic. Seasonal and considered purchases are not, and treating them the same misprices both.
Say you pull a cohort acquired last month and find it has produced almost no repeat revenue. Calling it low value is an arithmetic error. That cohort has not had time to repurchase. The technical name is right-censoring, and it is why recent cohorts always look worse than old ones in a naive report.
Report observed 30-, 60- and 90-day contribution value for every cohort, forecast the remainder as a range rather than a point, and keep a separate reactivation-adjusted figure for customers who return after a long gap. Then time lifecycle messages to each product's real reorder window instead of a universal day-30 rule.
A lifetime number is only as reliable as the cohorts behind it.
Segment before you message. For Seat Cover Solutions, Class A Media split the audience into first-time purchasers, high-LTV customers and dormant leads, because each group's expected gap between orders differs enough that one sequence would have mistimed all three. Mapping those groups properly is the groundwork for the customer lifecycle phases that follow.
The calculation itself takes minutes once the export is clean. Almost all the difficulty sits in what you remove before dividing.
1. Export twelve months of orders and net out refunds. Pull the order export, drop cancelled and refunded amounts from revenue, then count orders per customer. Skipping the refund step is the single most common reason a lifetime value comes back too high.
2. Divide net revenue by total orders. That's your average order value, $60 in the worked example. One division, one clean input.
3. Divide total orders by unique customers, then by years. Twelve months of data means dividing by one. A 24-month window divides by two. Stores often accidentally produce a monthly frequency and label it annual.
4. Measure lifespan from cohorts, with a buffer. Take the average time from first to last purchase among customers who have already stopped buying, then add an allowance for the customers still active and not yet finished. Customers still buying will extend the true average; ignoring them shortens it.
5. Multiply the three inputs. $60 × 2.5 × 3 years gives $450. Now move one input. Drop lifespan to two years and the same store gets $300. Show that range in any deck you present, because a single number invites false confidence.
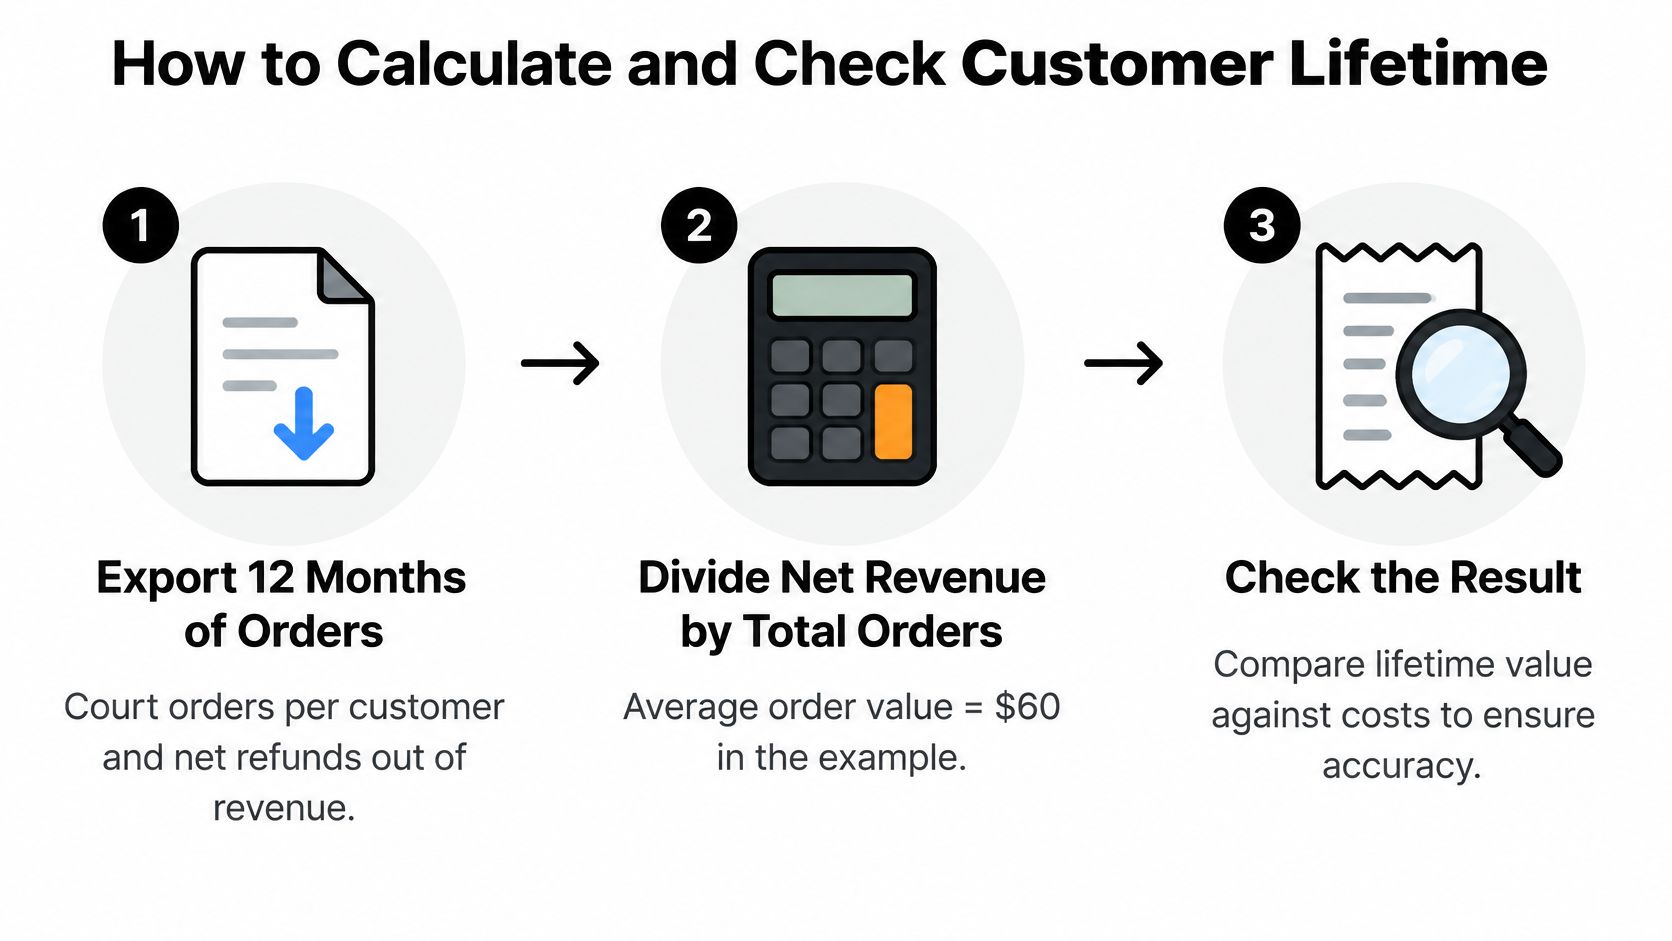
6. Compare the result against what the cohort has spent so far. If your model says a 12-month-old cohort is worth $450 and the export shows $95 collected, either the lifespan assumption is heroic or the frequency is wrong. Check both before you use the figure.
A 2024 analysis cited by Shopify put ecommerce customer retention at about 38%, and noted the figure swings widely by product category, natural repurchase interval and measurement period. A separate analysis of more than 156,000 direct-to-consumer customers found an average repeat-purchase rate of 18.8%, meaning roughly 81% of customers never placed a second order, both reported in the Shopify overview of ecommerce customer retention.
If your model implies that most customers repurchase repeatedly, those two figures are your warning light. Recheck the inputs before you build a budget on the output.
A healthy result has one defensible number per input, a stated range for lifespan, and a lifetime value you can walk a finance partner through without flinching.
Here's where the popular advice does real damage. Revenue lifetime value treats every dollar of sales as spendable, when the money available for retention sits well below the top line. A contribution version starts from the same $450 and subtracts the cost lines that move.
| Cost Line | What It Removes From Revenue |
|---|---|
| Product cost | Your landed cost of goods, including freight and duties |
| Payment and marketplace fees | Processing fees and platform commission |
| Shipping subsidies | Free-shipping thresholds you absorb |
| Returns | Refunded revenue plus the cost of handling the return |
| Discounts | Promotional markdowns already baked into the price paid |
| Customer support | Agents, tooling and the cost of handling one customer's tickets |
| Marketing | Acquisition and retention spend attributable to that customer |
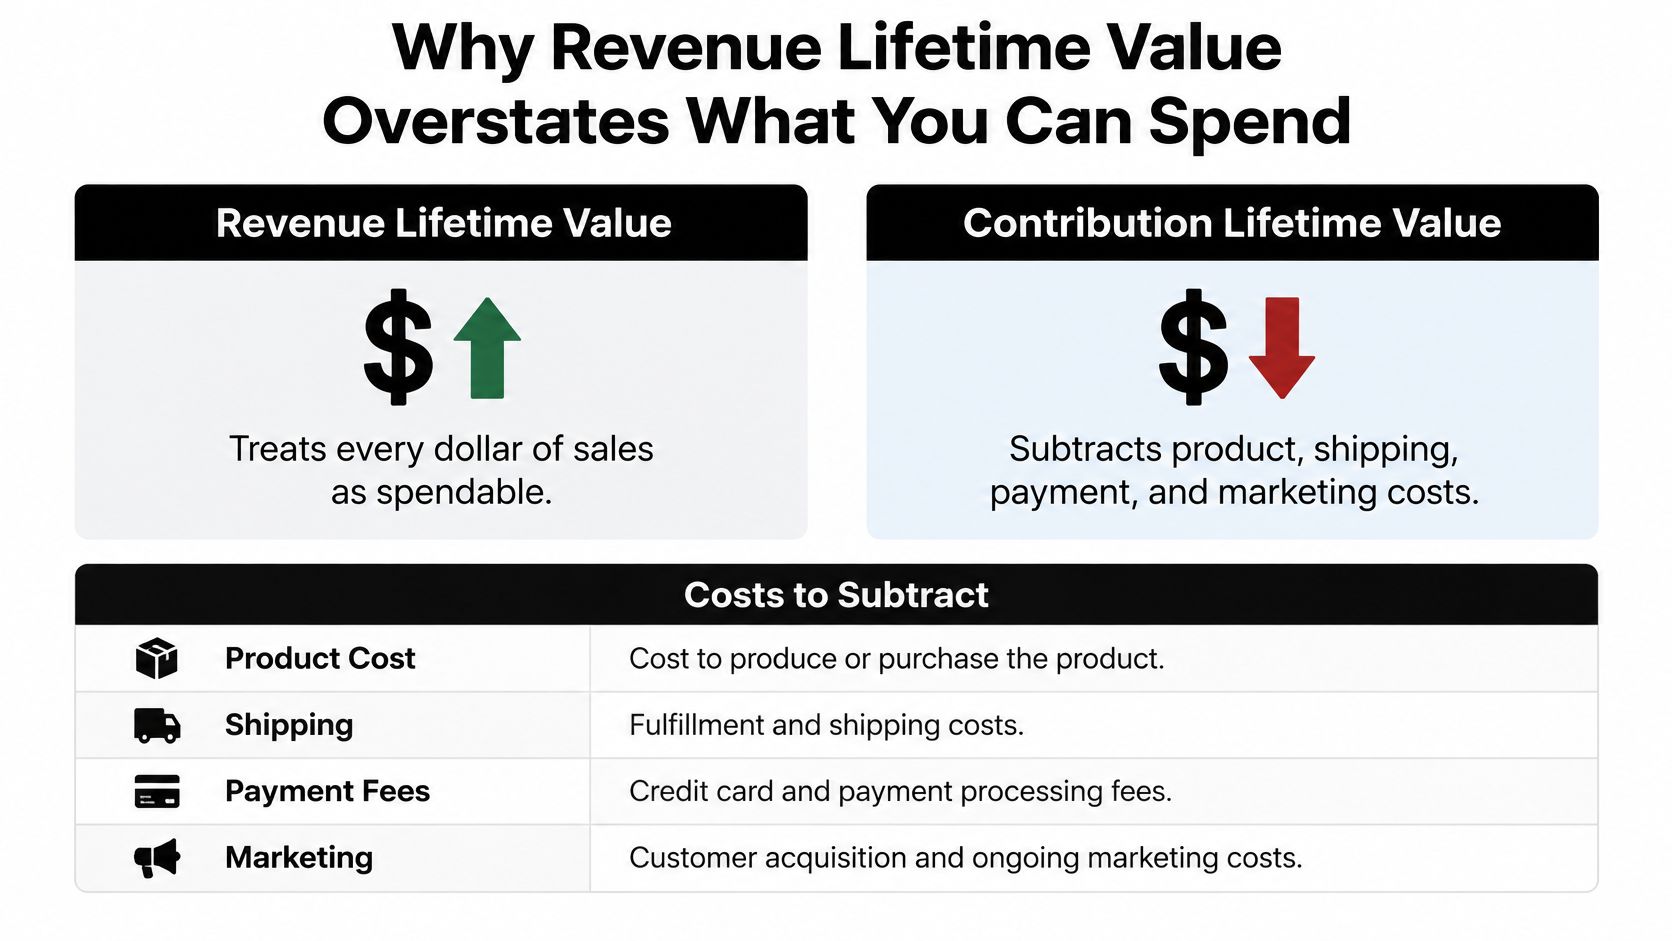
Take the same $450 customer. Product cost at 45% of revenue removes about $202. Payment fees at 4% take $18. Returns and discounts at 15% take another $67. Contribution lands near $160, roughly a third of the headline. That's the figure you can reinvest, and it's the figure that decides whether a win-back campaign at $25 per customer makes sense.
Some established frameworks define CLV as customer value minus total costs to serve, which is the customer lifetime value approach Shopify outlines. The practical consequence is that a high-spending discount buyer can be worth less than a lower-spending full-price buyer, because the second customer's margin per order is intact. Fashion, health and food brands feel this hardest, where return rates, spoilage and subscription discounts swing sharply by segment.
Practical rule: keep four numbers apart in your reporting. Gross revenue, gross profit, contribution profit and cash collected are not interchangeable.
Discount-driven loyalty is the trap in plain sight. A 2025 Shopify and Sapio Research holiday survey found that 49% of consumers cited discounts as a reason they remained loyal to retailers, as reported in Shopify's retention rate benchmarks by industry. Discount repeat orders look healthy on a revenue dashboard and thin on a contribution one. The same illusion shows up in paid acquisition, where why cheap CPI misleads media buyers traces how a low entry cost can hide an expensive customer.
Show sensitivity ranges, not one number. Then answer the question the number exists for, which is how much you can spend to win back or keep this particular customer. If you want the longer treatment of how contribution-based analysis changes segment decisions, the guide to customer lifetime value analysis goes deeper.
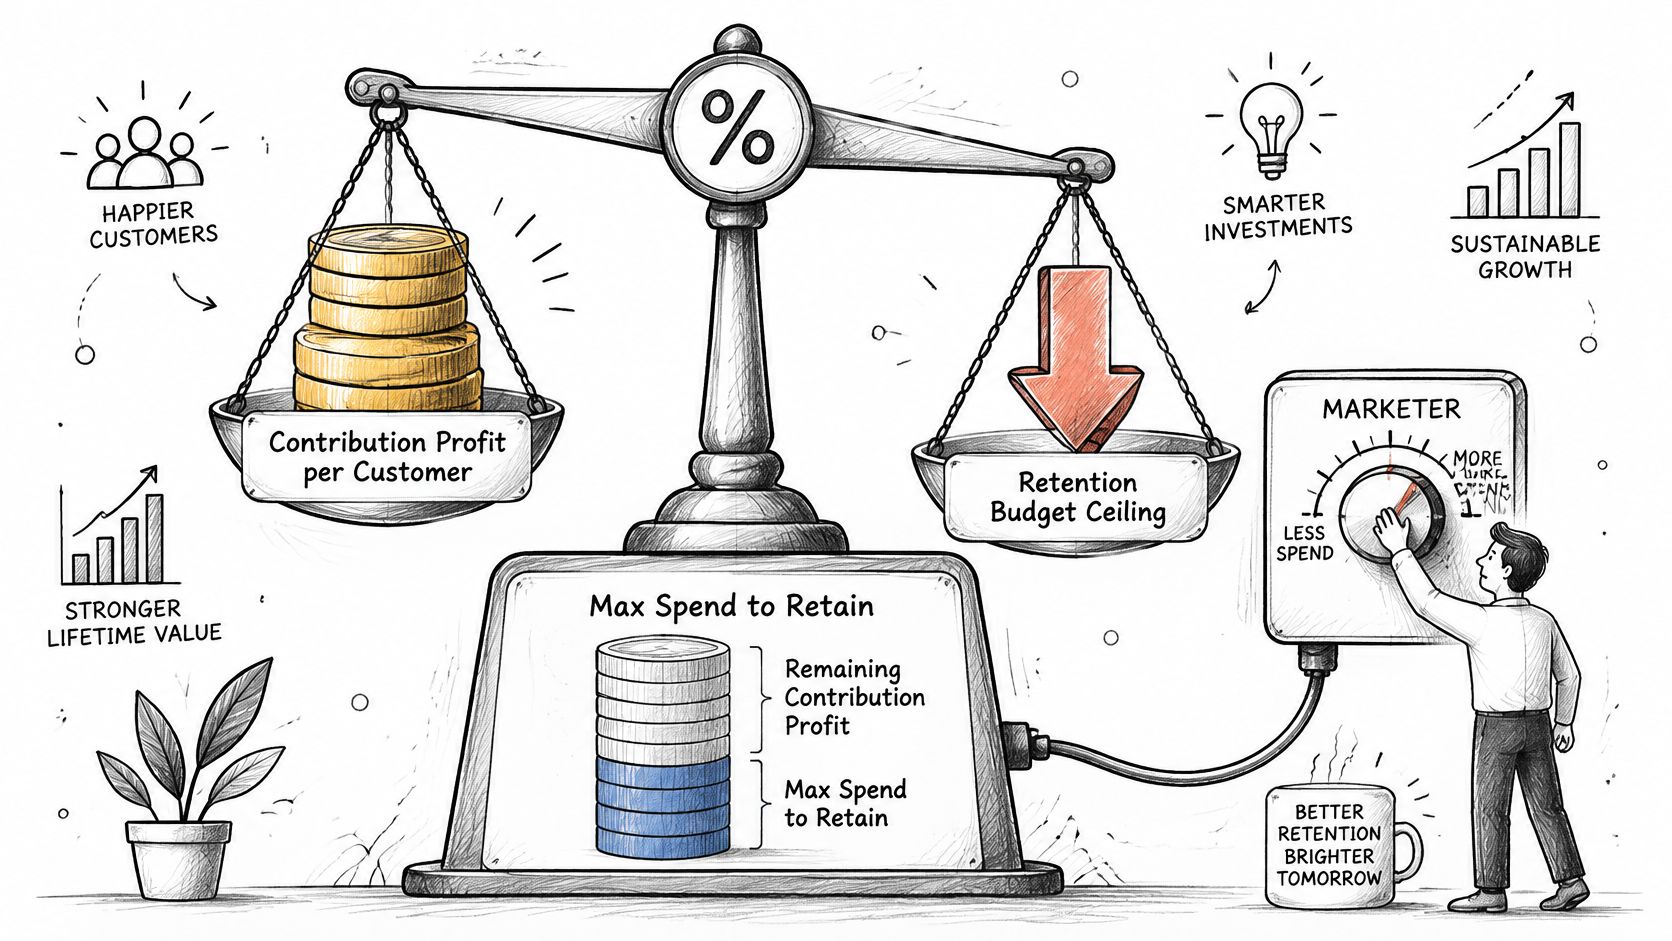
Treat the contribution figure as a ceiling. Set your maximum win-back or retention spend per customer as a share of contribution profit, then revise it when the cohort data moves. Spend in order of segment value instead of spreading budget evenly across customers who return different margins.
Timing decides where that money goes. An analysis of 40,397 direct-to-consumer repeat buyers found that 50% of second purchases happened within 30 days of the first order and 76.4% within 90 days, according to RetentionEdge's customer retention statistics. If your post-purchase sequence goes quiet after day 14, you are absent for the window where most second orders land.
Class A Media builds retention systems for more than 200 eCommerce brands without ad spend and without retainers, and the sequencing starts where second orders cluster. If post-purchase flows are the gap, a Klaviyo agency can build segmented lifecycle flows for a Shopify store rather than a single generic nurture sequence. The budgeting discipline resembles how agencies think about web design reseller recurring margins: the spendable number is what remains after delivery cost.
Write your three inputs and one contribution-based number into a sheet this week. That single row will do more for your retention budget than another dashboard, and it feeds directly into effective retention marketing strategies.
If lifetime numbers are built on revenue and a guessed lifespan, the retention budget is guesswork too. Class A Media builds email and SMS retention systems around contribution margin and cohort timing, with more than 200 eCommerce brands and over $150 million in attributable flow revenue behind the approach. Visit Class A Media to see how a segmented, flow-led system would work on your store.
Let's build retention system that drive predictable, scalable revenue - without ad spend, without retainers, without guesswork.


The Ultimate Ecommerce Email Marketing Agency
Get in touch: hello@classamedia.com