Blog post
Insights
Customer Lifetime Value Ecommerce Guide for Growth
Stop chasing a single “good” lifetime value number. That's the most popular advice in customer lifetime value ecommerce content, and it misleads Shopify owners more than it helps them. A supplement buyer who reorders quickly, a fashion buyer who shops by season, and an electronics buyer who replaces a product much later don't share one healthy timeline. Treat them as if they do, and you'll call loyal customers churned, rush discounts too early, or judge a new cohort before it's had time to buy again. A more useful approach treats lifetime value as a category specific cohort journey, measured with contribution margin and repurchase timing, then connected to email and SMS decisions.
A Shopify owner runs a successful launch weekend. New orders arrive, average order value looks strong, and the acquisition campaign appears profitable at first glance. Three months later, the same owner checks the cohort and sees something less exciting. Most of those buyers never returned.
That gap matters because first order revenue describes one transaction. Customer lifetime value, often shortened to CLV, describes the value a customer relationship creates over time. A campaign can produce a single sale without producing a repeat buyer, and those are very different business outcomes.
The retention context makes this distinction hard to ignore. The average annual ecommerce customer retention rate was 27.4% in 2024, meaning fewer than three out of every ten customers bought again the following year, according to Shopify's summary of Bluecore Customer Growth Benchmarks. If most first buyers don't come back, estimating value from the first order alone gives you an incomplete and often optimistic picture.
Ask a simpler question instead. How much profitable value can one customer relationship create over a defined period, and what share of customers reach a second or third order?
That question changes your decisions. You'll look beyond launch revenue toward second order conversion, purchase timing, margin after discounts and fulfillment, and category economics. You'll also stop assuming every new customer has the same expected path. A replenishable product invites a different journey from a durable good bought infrequently.
For a Shopify brand, the first order is best understood as an entry point. It gives you permission, data, and a starting date. Lifetime value begins when you can see whether that customer returns, when they return, and what remains after the costs of serving each order.
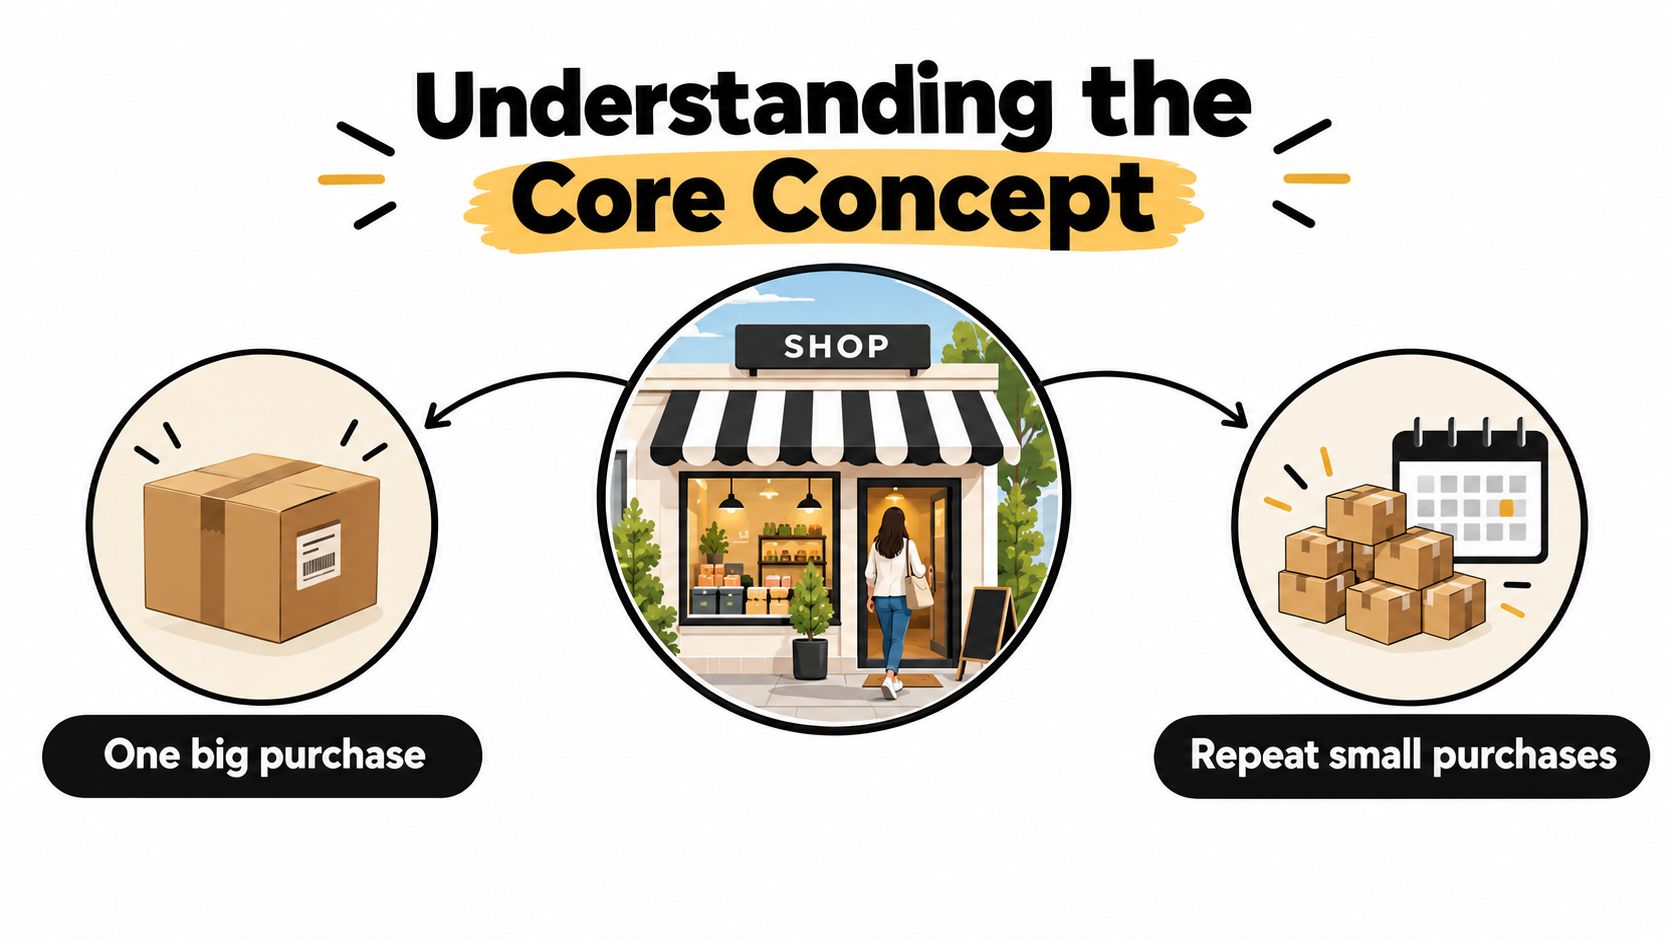
Think of each customer like a relationship with a neighborhood shop. One household places one large order and never visits again. Another spends less each visit but returns regularly for household basics. The shopkeeper who only remembers the largest receipt would misunderstand which household supports the business over time.
Your store works the same way. A high first order doesn't automatically create a high value customer, and a modest first order doesn't rule one out. What matters is the combination of orders, timing, and profit across the relationship.
The comparison below shows why one large purchase and several smaller repeat purchases can lead to different conclusions.
You can also use CLV in three different ways, and confusion starts when teams mix them. Historical CLV reports what a past cohort already spent. A cohort estimate uses early behavior to compare groups acquired at different times. A predictive model forecasts future value, but it remains a forecast. Each method can be useful. None gives you a timeless truth independent of category, margin, or observation period.
If you want a marketer focused companion to these definitions, this CLV guide for marketers is a useful reference alongside your own store data.
Core idea: Lifetime value grows through profitable repeat relationships, not through sending more messages to everyone at the same time.
Start with a simple revenue based model, then decide whether you need a margin based version. The basic formula is average order value multiplied by purchase frequency multiplied by customer lifespan. It's easy to explain, and it forces you to define each input before you trust the output.
Owners who build a recurring dashboard for these inputs may find these LTV dashboard setup tips helpful for organizing the reporting layer. The customer data feeding that dashboard still needs consistent identity and order history, which is why a solid approach to building a comprehensive customer profile matters before you automate decisions from the result.
| Input | What It Measures | Why It Matters |
|---|---|---|
| Average order value | Revenue per order | Shows basket size, but not repeat behavior |
| Purchase frequency | Orders per customer in a period | Shows whether customers return |
| Customer lifespan | Length of the buying relationship | Sets the horizon for the estimate |
| Contribution margin | Value left after direct order costs | Prevents unprofitable revenue from looking valuable |
| First to second purchase rate | Share reaching order two | Identifies the earliest retention bottleneck |
Suppose a fictional replenishment apparel brand uses placeholder inputs only to test its spreadsheet. Its illustrative average order is one unit of value, customers buy twice in the first modeled year, and the assumed lifespan is two years. That produces four units of revenue value before margin, compared with only one unit when you stop at the first order. The point isn't the placeholder result. It's the structure. Each extra order changes the output, and applying margin can lower the decision ready figure substantially.
Use the revenue version for an initial directional estimate. Use the margin version when you're setting acquisition limits, evaluating discounts, or deciding how much service and retention effort a segment can support. A formula can't tell you why customers returned, whether a discount caused the return, or whether a young cohort needs more time. Those questions belong to cohort interpretation.
A CLV number without a time frame is hard to interpret. A 30 day view emphasizes immediate repeat behavior. A 6, 12, or 24 month view can reveal slower seasonal or replacement cycles. Neither window is automatically correct. Each answers a different question.
The visual below contrasts a short early window with a longer view of the same buying journey.
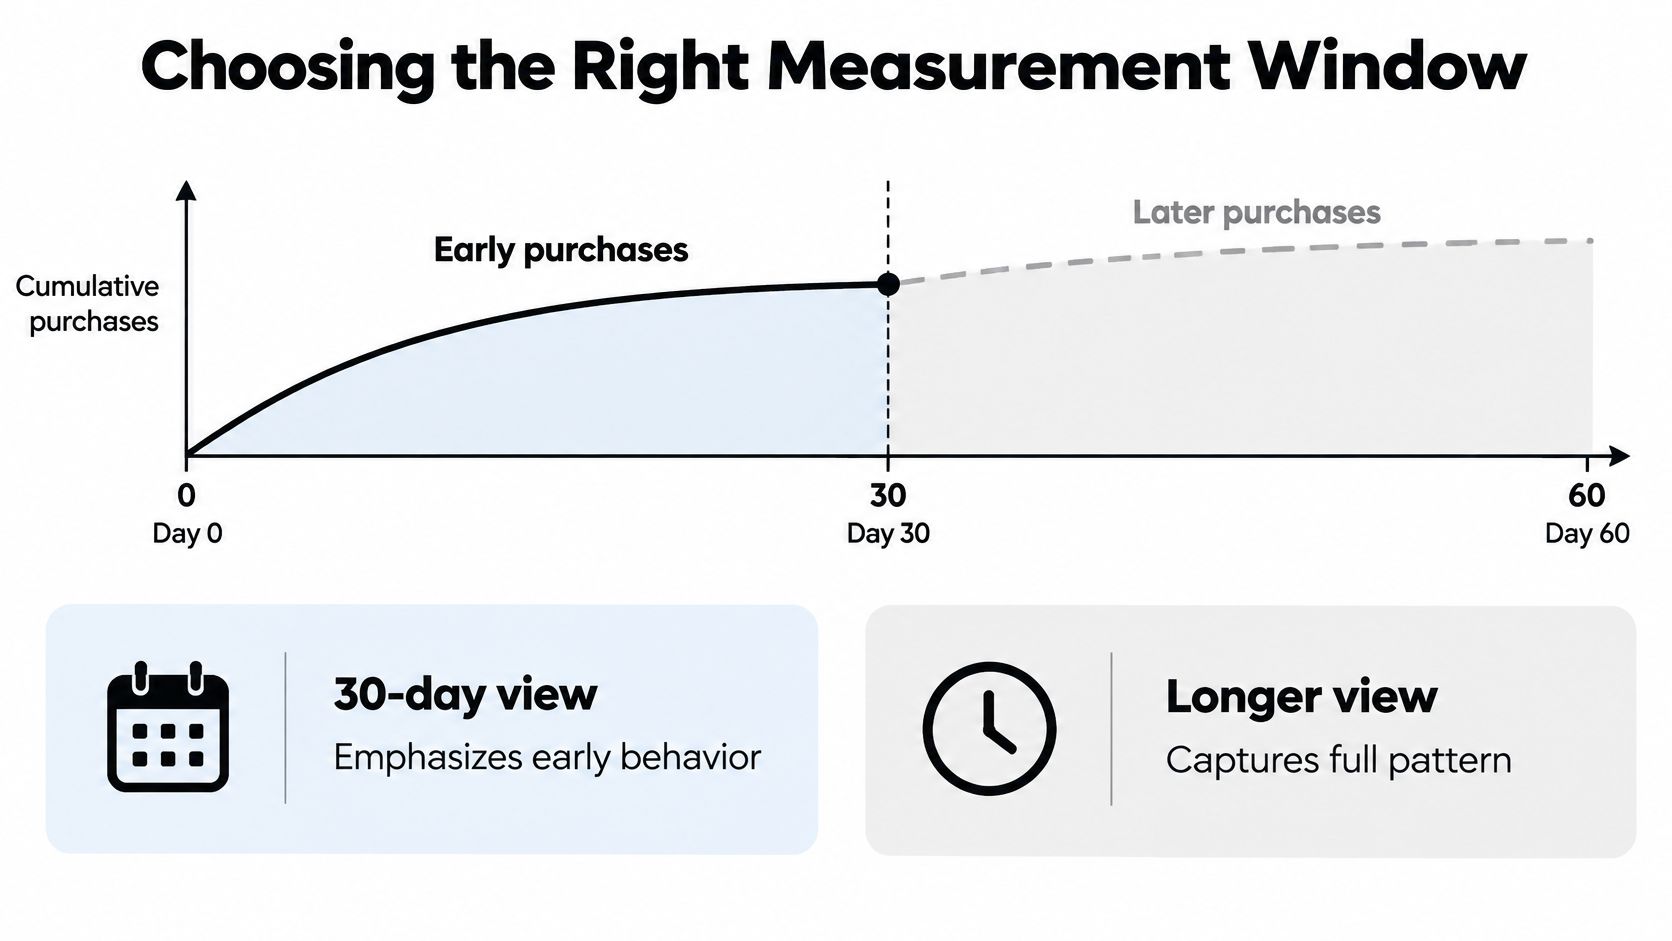
A cohort acquired last month hasn't had equal time to reorder compared with a cohort acquired last year. If you compare their lifetime totals directly, the younger group will almost always look weaker. That's a maturity problem, not necessarily a retention failure.
Compare cohorts at the same age instead. For example, compare each group's value after the same number of days since first order. You'll make a fairer judgment about acquisition quality and early lifecycle performance.
Durable goods create the opposite risk. A long natural replacement interval can look like inactivity when your window is too short. Before labeling customers lapsed, check whether the product should reasonably have been replaced yet.
Report CLV beside first to second purchase rate, median days to reorder, order count, and contribution margin. That set explains whether value changed because more customers returned, because they returned sooner, because baskets changed, or because discounts and costs changed the margin.
If you can't state the cohort, start date, and observation window, you can't explain what your CLV number means.
Owners often ask what repeat rate or lifetime value is “good.” Without a category, there's no responsible single answer. The average retention figure mentioned earlier hides major category differences. Health and beauty reached 41.2%, while jewelry was 19.1%, in data summarized by Shopify. A target that's plausible for replenishment can be unrealistic for infrequently replaced products.
Category movement also differs. Consumer packaged goods purchase frequency rose 13.95% year over year, recreation rose 8.68%, and home goods CLV growth was 6.46%, according to Smile's ecommerce customer loyalty report. Those differences reinforce why your own product cycle should set the measurement standard.
Track the same small set of measures for each meaningful category.
Fashion adds seasonality. A buyer may reasonably wait for a new season, a wardrobe need, or a product drop. Health and wellness often follows consumption, so timing can be tied to running low. Food and beverage can also reflect replenishment, but taste, household use, and subscriptions alter the pattern. Electronics and other durable goods may require a much longer horizon.
The contrarian point is simple. Maximizing raw purchase frequency isn't always the goal. For durable goods, a longer interval can be healthy. Pressuring those customers with frequent win back messages can create discounts and annoyance without changing a genuine replacement need.
A genuine retention problem appears when customers return less often than your own comparable cohorts, reorder later than the product cycle suggests, or generate weaker margin at the same checkpoint. Judge the curve against the category's natural rhythm first.
The scenarios below are illustrative patterns, not benchmarks or guaranteed outcomes. They use the same measures so you can see how interpretation changes when the purchase cycle changes.
This comparison introduces the contrast between a short replenishment rhythm and a longer seasonal rhythm.
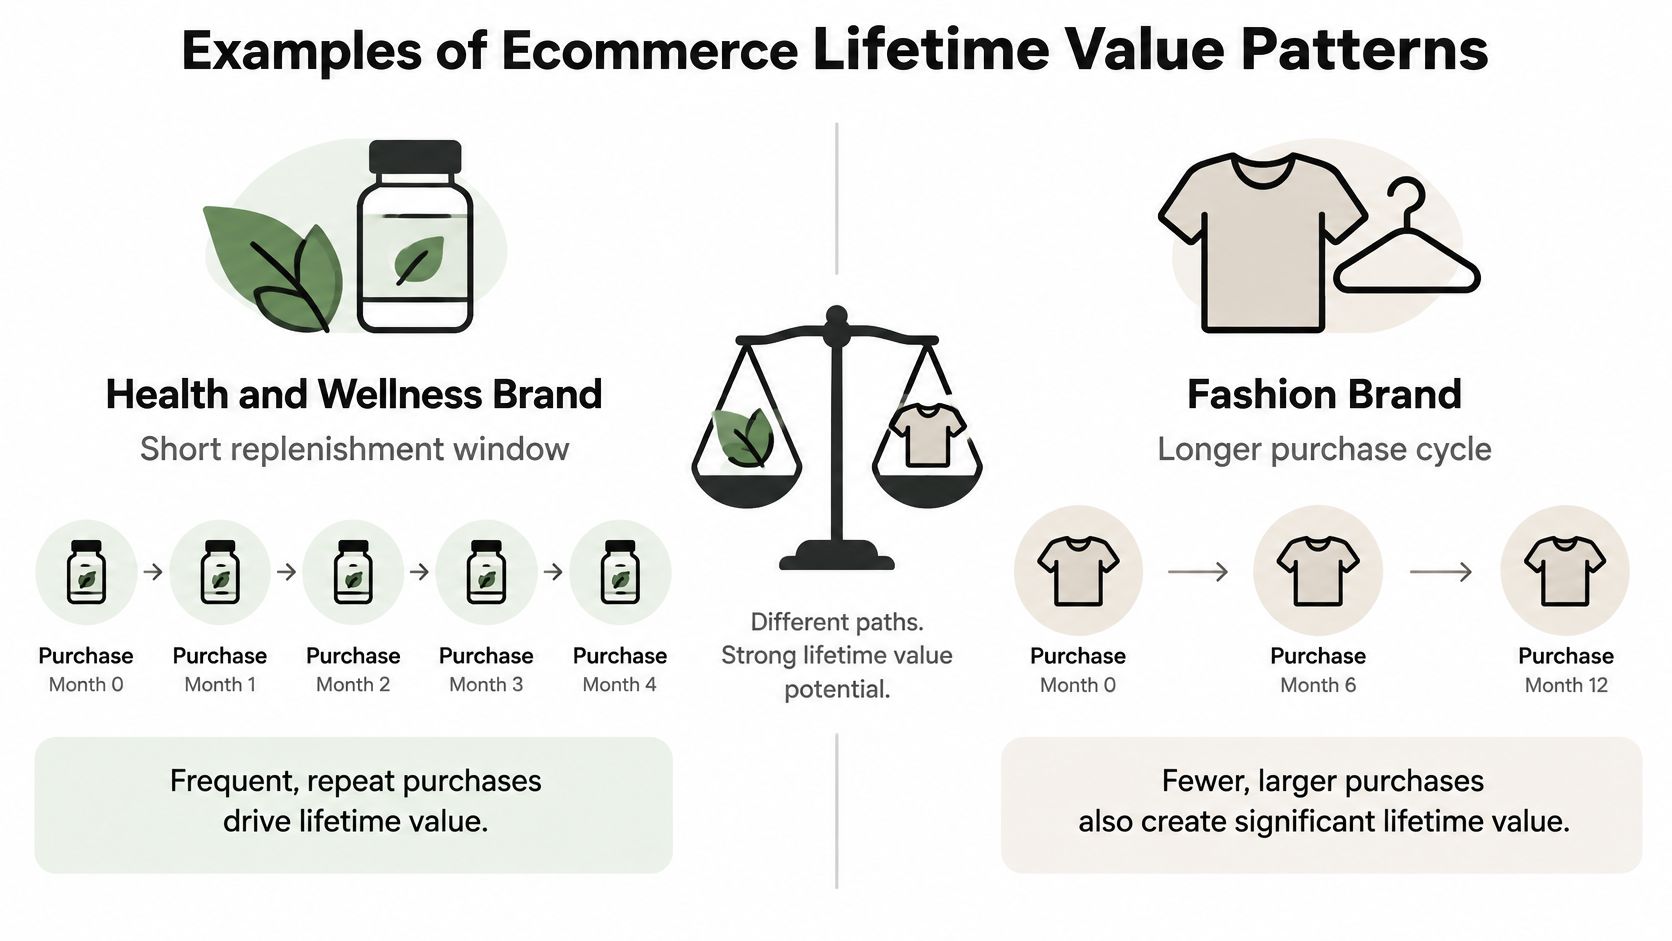
A wellness customer buys a consumable product and approaches the end of supply after a relatively predictable period. Record the first product purchased, expected use cycle, date of first order, and whether a second order arrives near replenishment. Here, median days to reorder is central. If customers return, but only after a deep discount, margin by second order tells you whether frequency came at too high a cost.
A fashion customer's second order may depend on fit satisfaction, season, new collections, and wardrobe gaps. A longer gap doesn't carry the same meaning as missing a consumable refill. Compare first to second purchase rates for cohorts acquired in similar seasons and through similar product categories. Average order value also matters because one seasonal basket can contribute meaningful value even when orders are spaced apart.
This walkthrough shows another way to visualize how repeat timing changes the meaning of the same CLV calculation.
Durable goods form a third pattern. Customers may report high satisfaction and still wait a long time before another need appears. Accessories, parts, care products, and eventual replacement can create value, but the main product cycle should define the window. A lower early repeat rate doesn't have the same consequence when the first basket carries strong margin and the replacement date is naturally distant.
The most important retention transition is usually first purchase to second purchase. Half of second purchases occurred within 30 days of the first order, and 76.4% occurred within 90 days, in data summarized by Ringly's customer retention statistics analysis. That timing doesn't mean every brand should use the same 30 day flow. It means you should investigate your own early window first.
The process below places the retention effort between those first two orders.
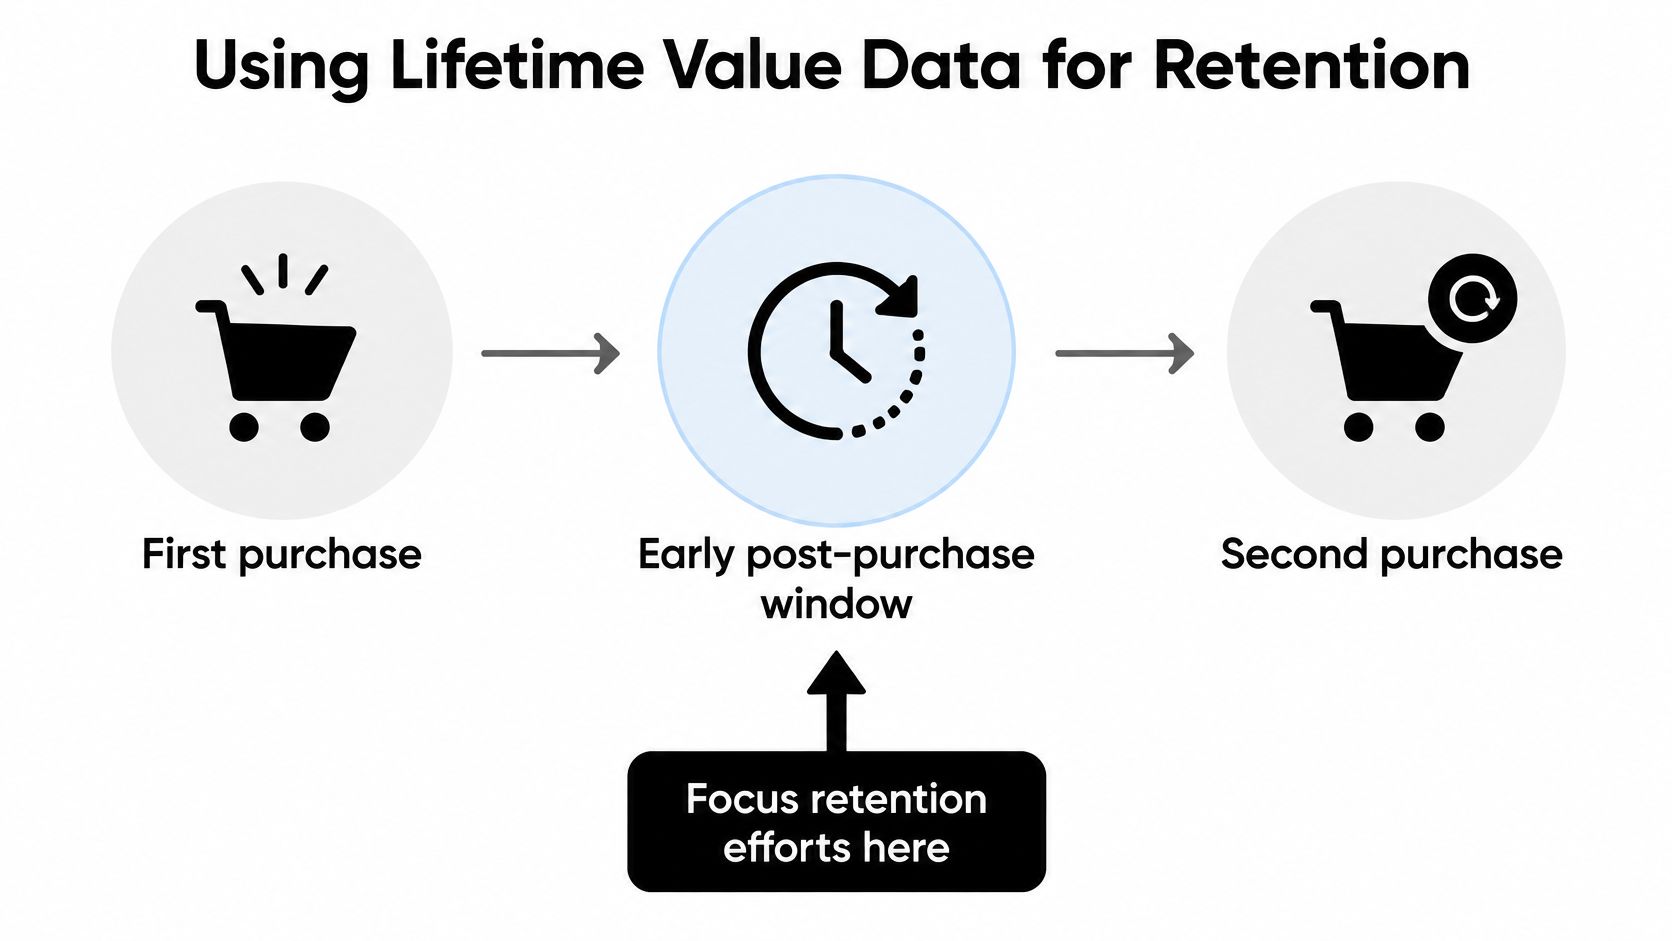
Use three timing layers instead of one generic win back sequence.
Segment by first product, category, elapsed time since first order, order count, and observed browsing or purchase behavior. A practical overview of customer segmentation models for lifecycle marketing can help you choose groupings that are large enough to act on. For a founder level view of the repeat purchase denominator and timing, this guide for Shopify founders is relevant reading.
Shopify owners who need help turning those segments into flows can consider partners such as Class A Media, which builds custom email and SMS automation systems for ecommerce brands. Whether you build internally or with support, the timing logic should come from your cohort data rather than a template copied from another category.
Measure the commercial result. Opens and clicks can diagnose attention, but they don't prove retention. Track second order conversion by segment, days to second order, revenue per cohort member, contribution margin, unsubscribe behavior, and repeat orders after the campaign window. A message can earn clicks while the cohort still fails to buy again.
Also protect margin. If an early reminder works without an incentive, don't train customers to wait for one. Save stronger offers for segments whose expected contribution and overdue timing justify the cost.
Don't set one blended CLV target for the whole store and call the work finished. Use a repeatable operating routine that respects product timing and verifies real repeat outcomes.
Before acting, verify data quality, duplicate customer records, cohort maturity, sample size, and attribution boundaries. Then ask whether additional retention investment is justified by repeat purchases and contribution, not engagement alone.
Decision check: A CLV improvement only counts when comparable customers buy again and the added orders remain profitable.
Stronger lifetime value begins with understanding the customer's real journey after checkout. The first order opens the relationship. It isn't the finish line.
If your Shopify cohorts show strong first orders but too few second purchases, Class A Media can build custom email and SMS lifecycle flows timed to your products' real replenishment, seasonal, or replacement cycles. Its one time project model is designed to create retention infrastructure without an ongoing agency retainer, and you can explore whether it fits your store at Class A Media.
Let's build retention system that drive predictable, scalable revenue - without ad spend, without retainers, without guesswork.


The Ultimate Ecommerce Email Marketing Agency
Get in touch: hello@classamedia.com